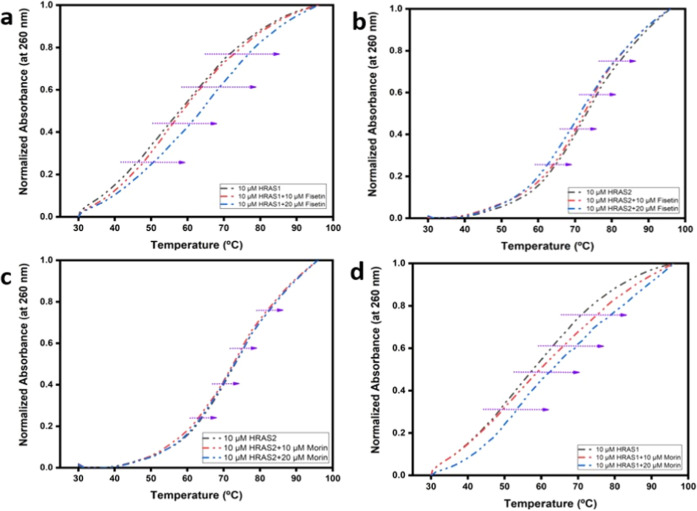
Figure 8.
Upper panel: UV melting profiles of HRAS1 (a) and HRAS2 (b) IM DNA (10 μM) alone and in the presence of fisetin (10 and 20 μM). Lower panel: UV melting profiles of HRAS2 (c) and HRAS1 (d) IM DNA (10 μM) alone and in the presence of morin (10 and 20 μM). Variations of the DNA melting temperature (ΔTm) in °C induced by fisetin and morin.

