
Figure 1.
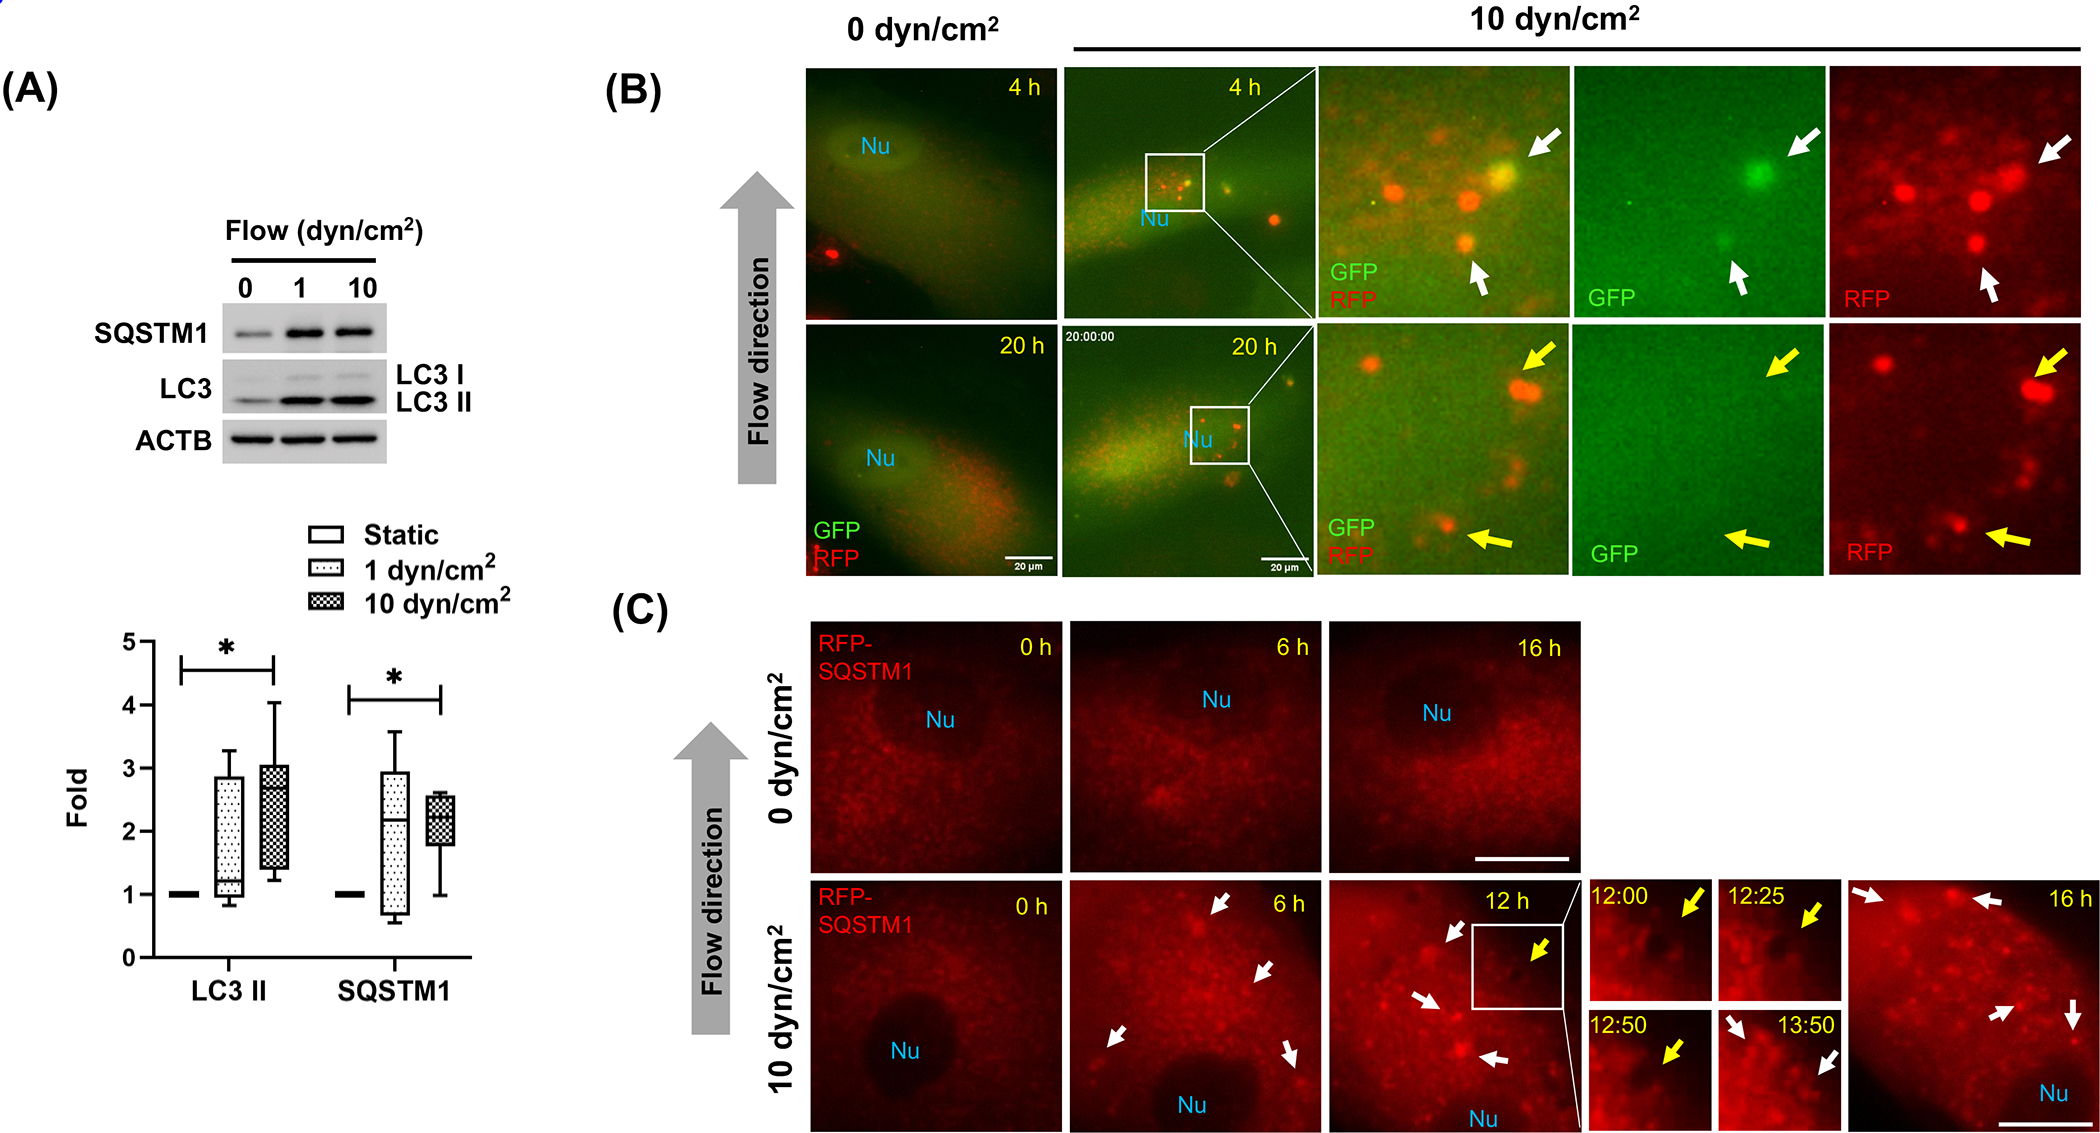
Autophagy is activated by shear stress in human primary SC cells. (A) Western blot analysis for protein expression levels of LC3 and SQSTM1 in human SC cells subjected to different flow rates (1 or 10 dyn/cm2) for 24 h. Band densities were quantified by Image Lab™ touch software, normalized with ACTB and fold changes calculated and graphed. Max to min and mean values are shown in interleaved box and whiskers plot (n=6). *, p<0.05, (One-way ANOVA with Tukey’s post hoc test). (B-C) Live cell imaging of tfLC3- or RFP-SQSTM1-transduced human SC cells in the presence or absence of fluidic flow (0 or 10 dyn/cm2). Time-lapse live cell images were acquired with CELENA® X High Content Imaging System equipped with the ibidi stage top incubation system and processed by Fiji software. White arrowhead and yellow arrows represent autophagosome and autolysosomes, respectively (B). SQSTM1 aggregates and autophagic-like vacuole are indicated by white and yellow arrows, respectively (C). Scale bars: 20 μm. Nu: nucleus.