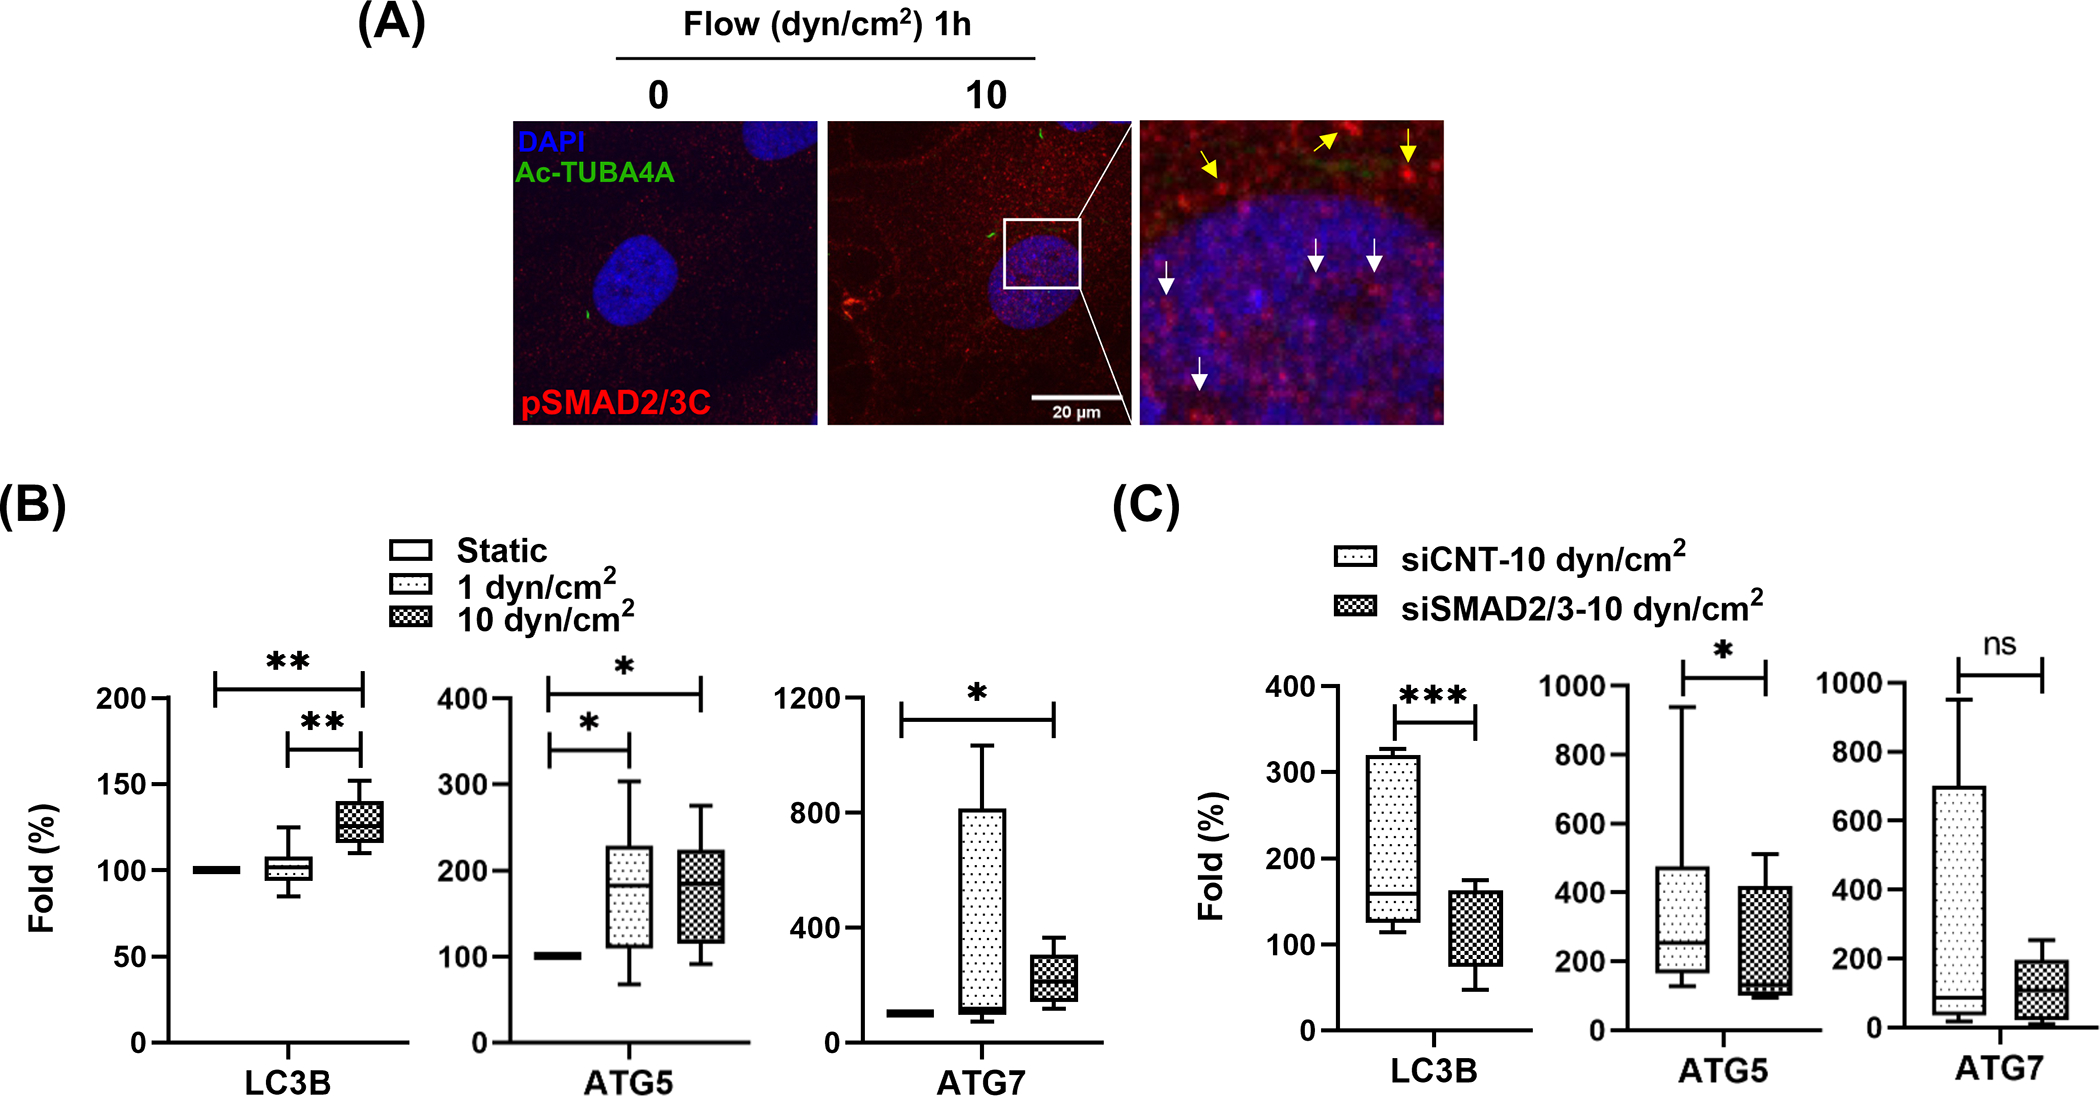
Figure 6.

SMAD2/3 regulates transcription of LC3 in response to shear stress in SC cells. (A) Immunocytochemistry analysis of pSMAD2/3C localization. One hour after shear stress (10 dyn/cm2), SC cells were immunostained with pSMAD2/3C (red fluorescence) and acetylated TUBA4A (green fluorescence) antibodies. DAPI was used to stain nuclei. Images were acquired with confocal microscope and processed by using Fiji software. The fluorescent signals stained with pSMAD2/3C in nucleus and cytosol are indicated by white and yellow arrows in inbox, respectively. (B) Quantitative real-time PCR analysis for examining expression levels of ATG genes in SC cells subjected to fluidic flow (1 or 10 dyn/cm2) for 24 h. The mRNA expression level of LC3B, ATG5 and 7 were normalized by that of B2M. For calculating fold changes, the mRNA expressions of each gene in controls cells (0 dyn/cm2) were set to a value of 100%. Data are shown as interleaved box and whiskers plot (n =3). *, p<0.05; **, p<0.01 (One-way ANOVA with Tukey’s post hoc test). (C) SMAD2/3 knockdown effect on the mRNA level of the ATG genes in SC cells subjected to shear stress (10 dyn/cm2). Data are shown as interleaved box and whiskers plot (n =3). *, p<0.05; ***, p<0.001; ns, not significant (Student’s t-test).
