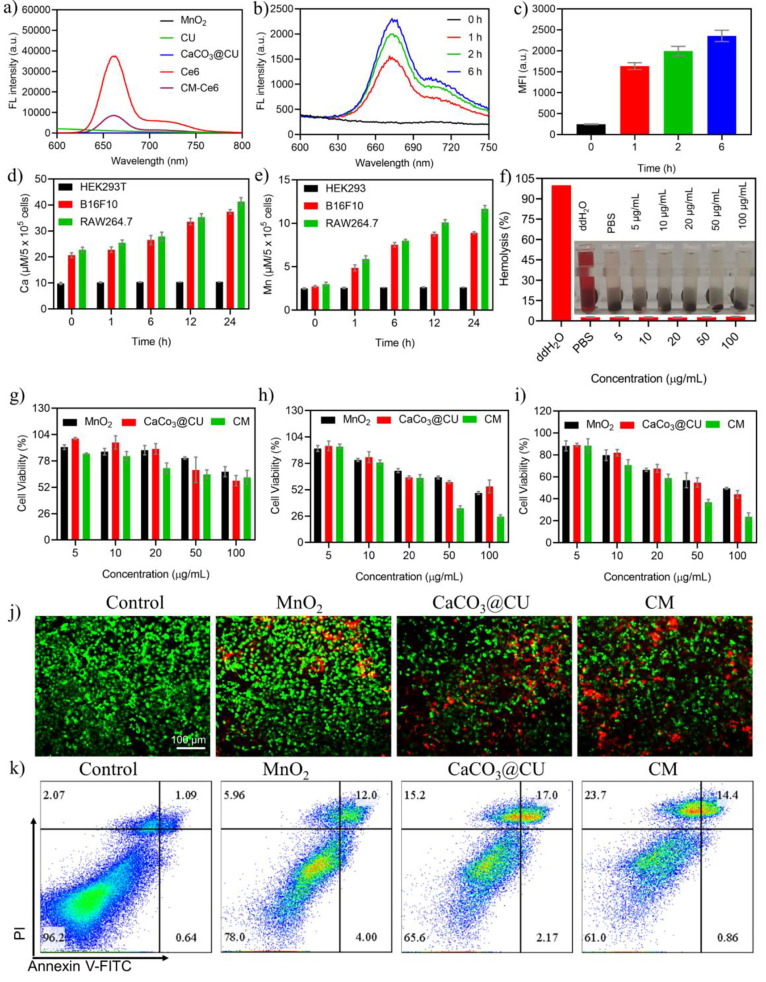
Figure 3.
In vitro treatment effects of CM NPs. (a) Fluorescence spectrum of Ce6-labeled NPs; (b) fluorescence spectrum of Ce6 in B16F10 cancer cells at different time points; (c) fluorescence intensity analysis of B16F10 cancer cells at different time points; (d)-(e) Manganese and calcium concentration in HEK293T, B16F10, and RAW274.7 cells after incubation for different time points (n = 3); (f) hemolysis assays with different concentrations of CM NPs (n = 5); (g)-(i) relative viabilities of HEK293T, HeLa, and B16F10 cells after treatment with different types and concentrations of nanomaterials for 24 h (n = 4); (j) calcein-AM/PI staining after treatment with different nanomaterials (50 μg/mL); (k) flow cytometry analysis of Annexin V-FITC/PI costained B16F10 cancer cells (50 μg/mL). Data are presented as the mean ± SEM.

