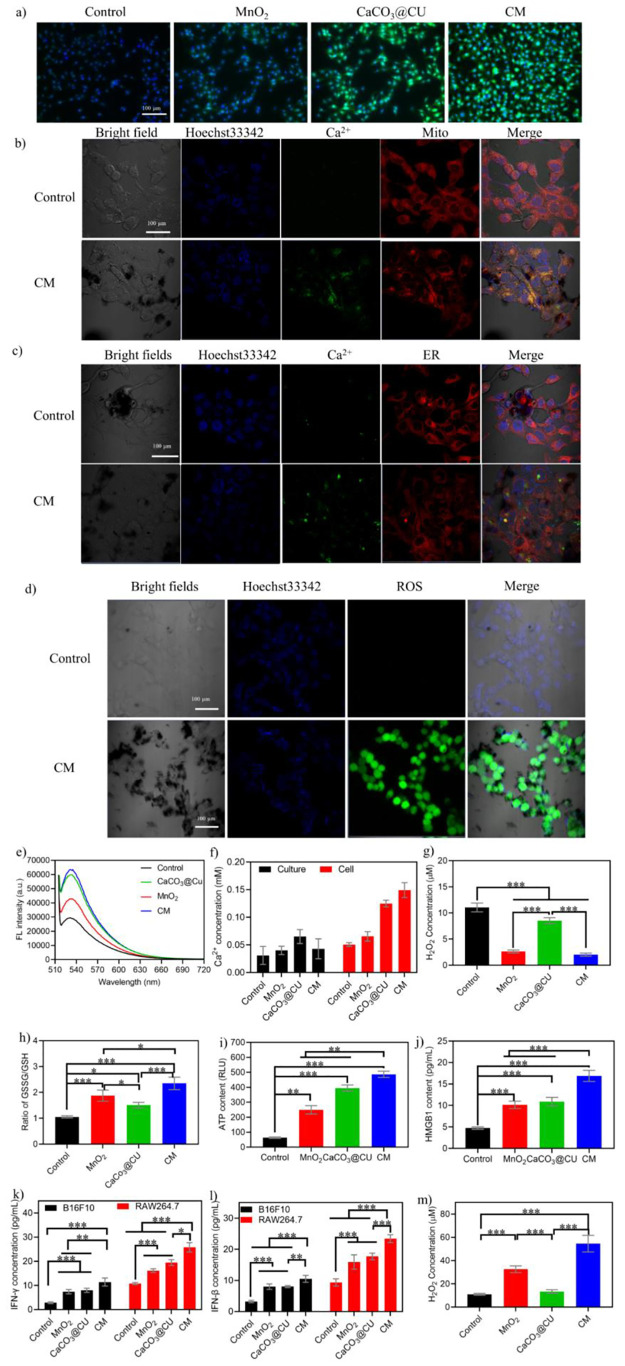
Figure 4.
TME modulation and immune activation in cancer cells. (a) Representative images stained by a pH probe after treatment with different nanomaterials; (b) CLSM imaging of Ca2+ alteration in mitochondria; (c) CLSM imaging of Ca2+ alteration in the ER; (d) representative images showing ROS levels after treatment with CM NPs; (e) fluorescence spectrum of BCECF AM, indicating the changes in intracellular pH values; (f) extracellular (cell culture) and intracellular Ca2+ levels (n = 3); (g) quantification of intracellular H2O2 levels after treatment with various nanomaterials (n = 3); (h) quantification of intracellular GSSH/GSH after treatment with various nanomaterials (n = 3); (i) levels of ATP released after treatment with various nanomaterials (n = 3); (j) levels of secreted HMGB1 in cell culture after treatment with various nanomaterials (n = 3); (k) IFN-γ levels in RAW264.7 cells after fed with B16F10 cancer cells treated with various nanomaterials (n = 3); (l) IFN-β levels in RAW264.7 cells after fed with B16F10 cancer cells treated with various nanomaterials (n = 3); (m) H2O2 levels in M2 macrophages after treatment with various nanomaterials (n = 3). Data are presented as the mean ± SEM. P values were calculated using one-way ANOVA. *p < 0.05, **p < 0.01, ***p < 0.001, and ****p < 0.0001.

