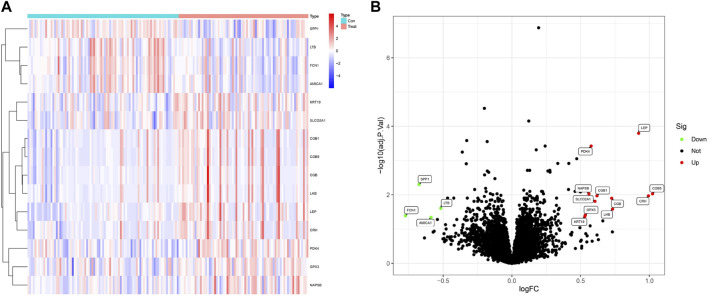
FIGURE 2.
Identification of DEGs. (A) Heatmap plots of 15 DEGs between preeclampsia tissue and normotensive control pregnancy samples from the GEO database. Row name of heatmap is the gene name, and column name is the ID of samples which is not shown in the plot. Red to blue represent the expression level from high to low in the heatmaps. (B) Volcano plots of 15 DEGs between preeclampsia tissue and normotensive control pregnancy samples. Red dots in the volcano plots represent upregulation, green dots represent downregulation, and black dots represent genes without differential expression.

