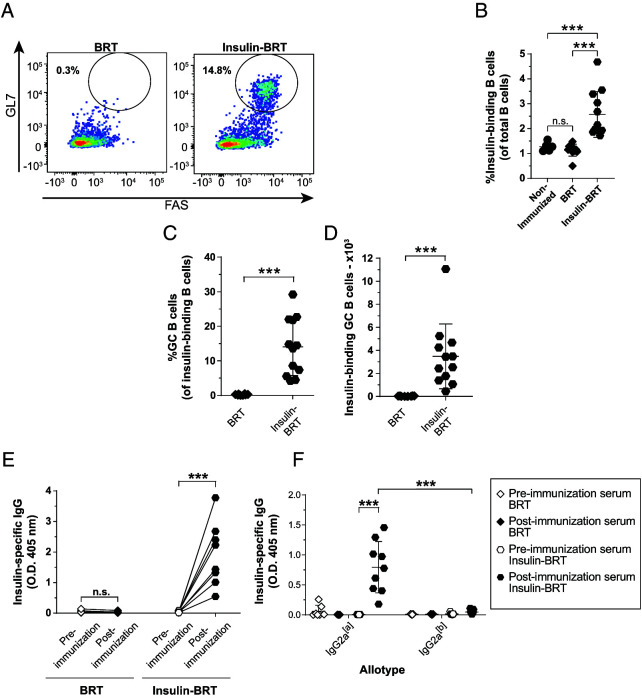
FIGURE 4.
TI immunization results in anti-insulin Ab production and robust anti-insulin GC B cell expansion.
VH125SD.NOD mice were immunized with the TI immunogen, BRT, or insulin-conjugated BRT (insulin BRT) s.c. at the base of the tail as described in Materials and Methods. Draining medial iliac lymph nodes and sera were harvested 5 d after immunization. (A) Representative flow cytometry plots identify GC B cells among insulin-binding B cells as in Fig. 1 in draining lymph nodes of mice immunized with BRT (left) and insulin BRT (right). The frequency of (B) insulin-binding B cells among total B cells after immunization with either BRT or insulin BRT. The frequency (C) and number (D) of GC B cells among insulin-binding B cells between nonimmunized, BRT and insulin BRT immunized mice are plotted for n ≥ 6 mice per group, n ≥ 2 experiments. The insulin-binding GC B cell frequency (C) is shown for mice that had >20 insulin-binding B cells in the parent B cell gate. (E and F) Anti-insulin Ab was measured by ELISA in VH125SD.NOD sera before and after immunization with BRT alone or insulin BRT (n ≥ 7 mice plotted per group). (E) Total insulin-specific IgG or (F) allotype-specific anti-insulin IgG2a indicates transgenic (IgG2a[a]) or endogenous (IgG2a[b]) B cell origin. All mice were 8–14-wk-old male and female NOD mice. ***p ≤ 0.001, two-tailed t test (D and E) or Mann-Whitney U test (B and C).

