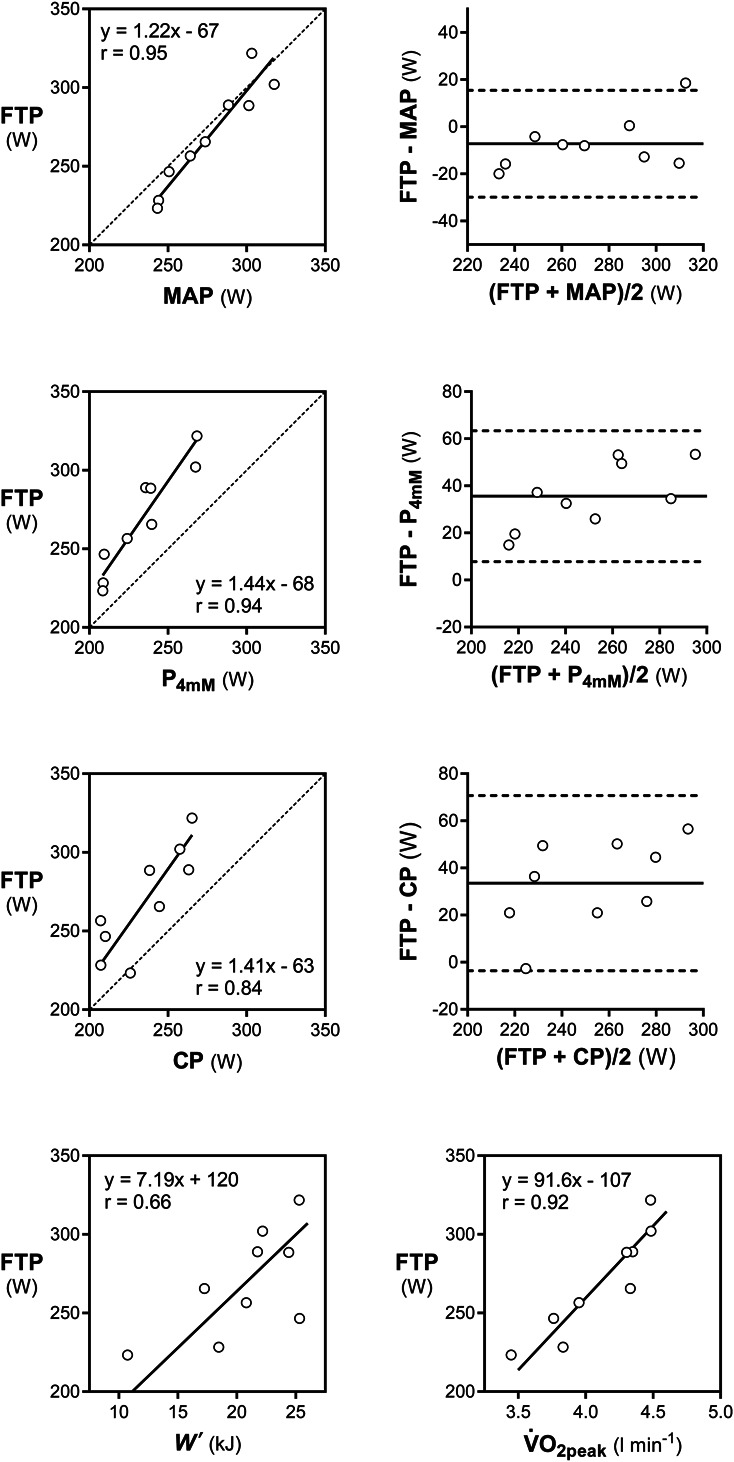
Figure 3.

Comparison of selected laboratory parameters with the FTP. FTP = functional threshold power; CP = critical power; P4mM = power output at the 4-mM blood lactate concentration; MAP = maximal aerobic power of the incremental test; = peak oxygen consumption of the incremental test; W′ = curvature constant of the CP model.
