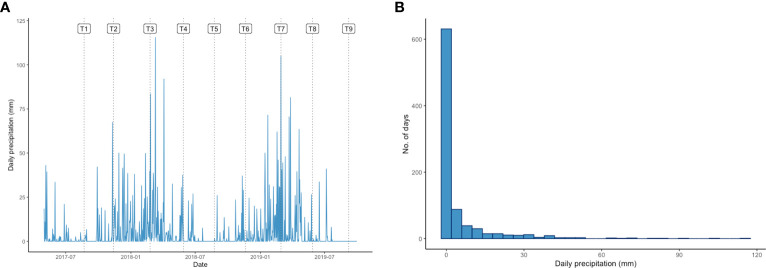
Figure 1.
(A) Daily precipitation (mm) pattern in Lampung over the experimental period. Labels T1-T9 indicate the sampling time points for this study: 22 August 2017 (T1), 13 November 2017 (T2), 24 February 2018 (T3), 29 May 2018 (T4), 24 August 2018 (T5), 20 November 2018 (T6), 28 February 2019 (T7), 28 May 2019 (T8), and 7 September 2019 (T9). (B) Histogram showing the daily precipitation distribution (mm) in Lampung during the experimental period.

