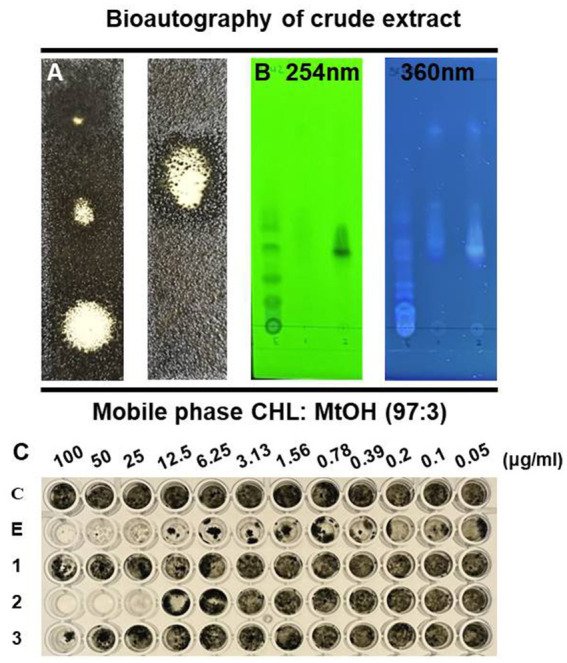
Figure 1.

TLC profile of the crude extract from P. sesami BC42. (A) Bioautography, (B) viewed under UV light, and (C) minimum inhibitory concentration of crude extract. Symbols used: C; control, E; ethyl acetate extract of BC42, 1; line 1, 2; line 2, 3; line 3.
