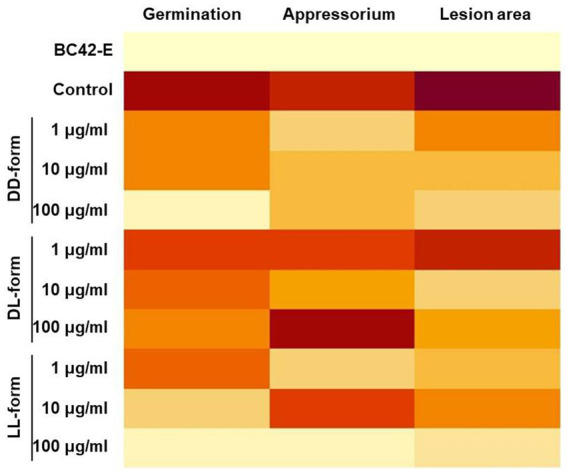
Figure 5.

Heatmap of the differentially expressed results in germination, appressorium formation, and lesion area compared with each treatment. Dark red (the higher value) ~ light yellow (the lower value). A heatmap was constructed using the average of each treatment.
