Figure 2.

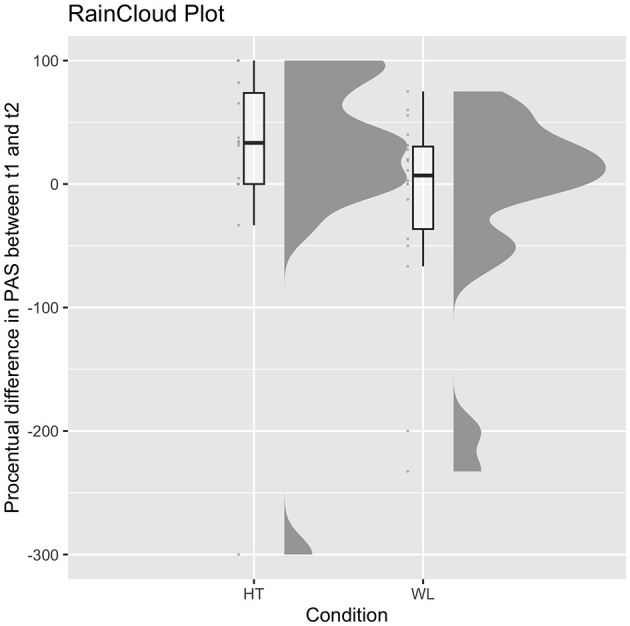
Medians and distributions of both groups in the percentage symptom reduction in PAS in the PP sample and individual scores. HT, hypnotherapy; WL, waitlist control group.

Medians and distributions of both groups in the percentage symptom reduction in PAS in the PP sample and individual scores. HT, hypnotherapy; WL, waitlist control group.