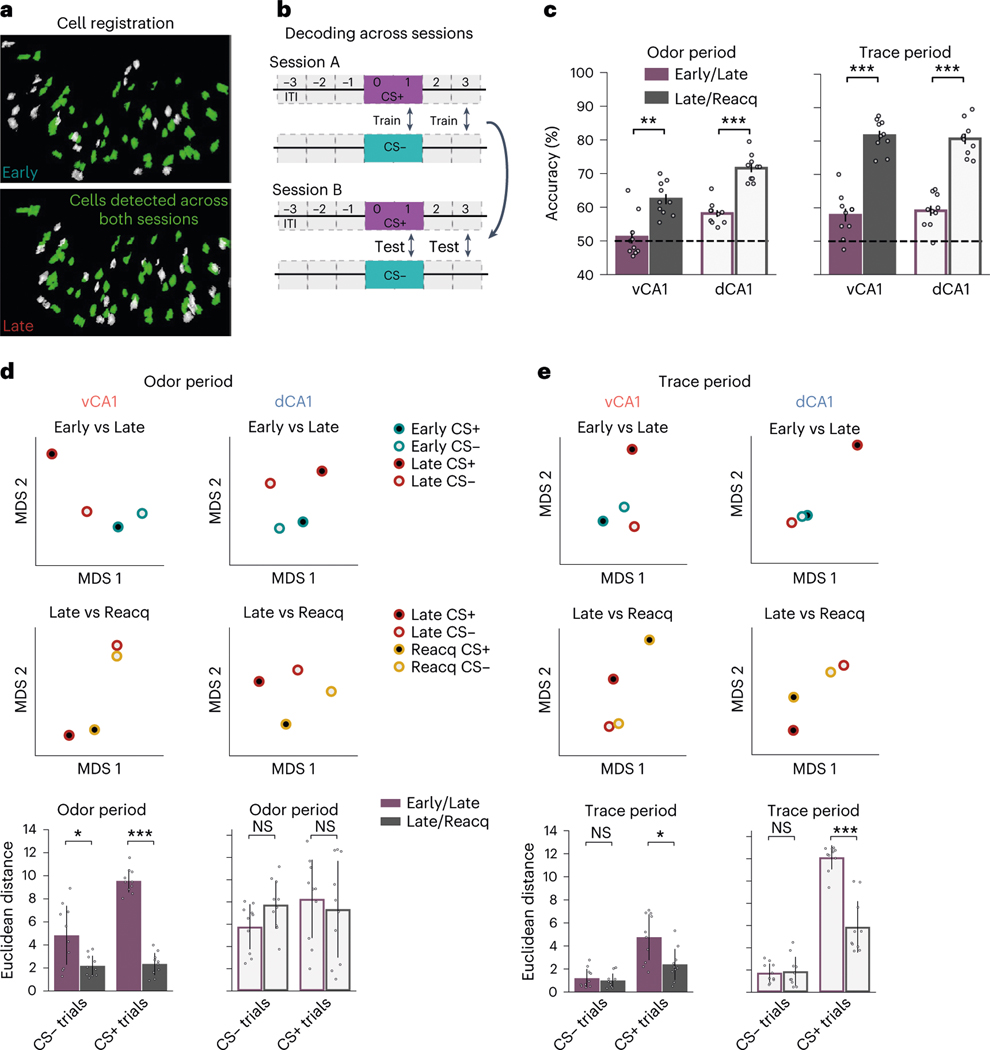
Fig. 4 |. Task representations stabilize with learning.
a, Example of cells from the same FOV registered across Early and Late sessions. b, Across-session trial-type decoding schematic. A linear decoder was trained to discriminate CS+ versus CS− population activity during one session (session A), and classification accuracy was tested using CS+ and CS− activity patterns from a different session (session B). The reciprocal direction (train on session B, test on session A) was also analyzed, and final decoding results reflect the average of both directions. c, Across-session decoding results (n = 10 decoding iterations from -matched 241 cells; two-sided Mann–Whitney -test; error bars indicate mean ± s.e.m.). Decoding performance is significantly higher for odor and trace periods after task acquisition (Late/Reacquisition) versus during learning (Early/Late), indicating a stabilization of task representations after learning. Despite high odor period decoding accuracy in dCA1 for Early and Late sessions individually (Fig. 3e), decoding across these sessions was comparatively low. Thus, although dCA1 activity distinguishes odors robustly at all training points, odor representations are transformed with learning. d, To analyze within-session and across-session similarity between trial-type population activity patterns, we projected the hyper-dimensional neural data onto two-dimensional space via MDS (Methods). Here, the relationship between activity patterns is represented in geometrical space; the closer two points are in space, the more similar their activity patterns are. Top: two-dimensional dot plots showing an individual MDS run. Bottom: average Euclidean distance between specified points. In vCA1, CS+ odor representations show considerable transformation with initial learning (Early/Late) but then largely stabilize (Late/Reacquisition), whereas CS− odor representations show comparatively little change with learning. dCA1 odor representations fluctuate across all sessions (n = 10 MDS runs; two-sided Mann–Whitney -test with Bonferroni correction; error bars indicate mean ± s d ). e, As d but for trace period. CS− trace representations show little change with learning, whereas CS+ representations show large initial changes with learning that then stabilize (n = 10 MDS runs; two-sided Mann–Whitney -test with Bonferroni correction; error bars indicate mean ± s d ). *P < 0.05, **P < 0.01, ***P < 0.001. See Supplementary Table 1 for all statistical analysis details. NS, not significant.

