
Figure 3.
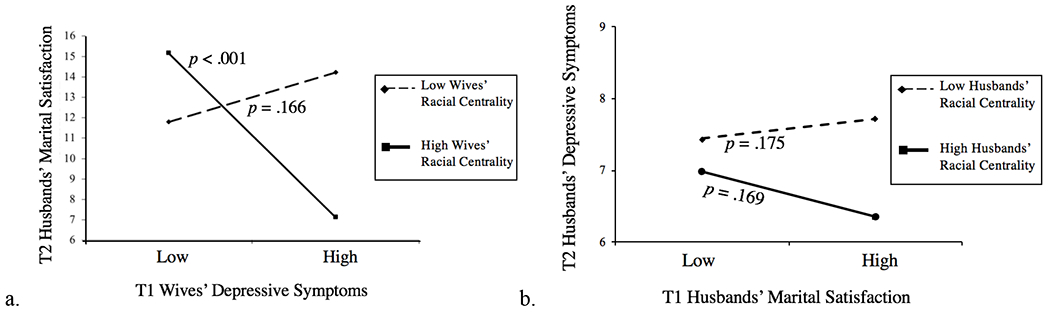
The left panel (a) depicts the prospective association between wives’ depressive symptoms and husbands’ marital satisfaction at high versus low levels of wives’ racial centrality. The right panel (b) depicts the prospective association between husbands’ marital satisfaction and husbands’ depressive symptoms at high versus low levels of husbands’ racial centrality. T1 = Time 1; T2 = Time 2.