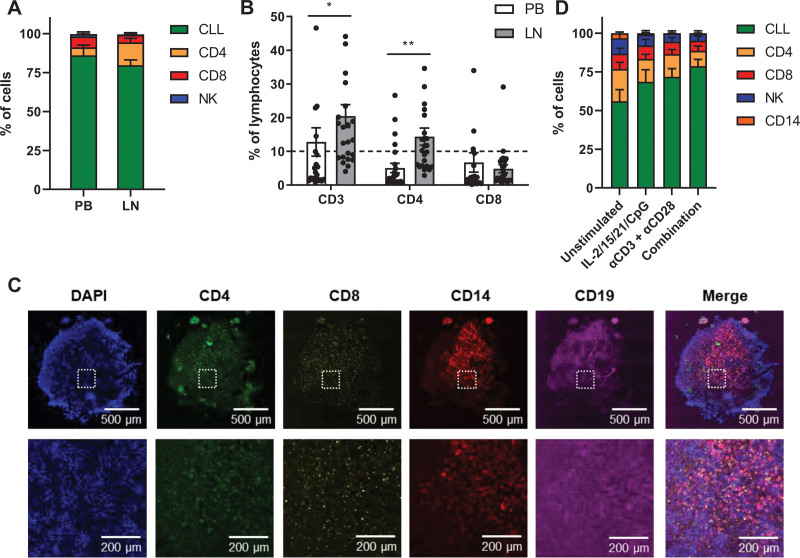
Figure 1.
Design of a PBMC-based LN model. (A and B) Lymphocytes were isolated from paired PB and LN samples and characterized in treatment-naïve CLL patients (n = 24). (A) Cells were gated based on the following surface markers: CLL (CD5+/CD19+), CD4+ T cells (CD3+/CD4), CD8+ T cells (CD3+/CD4+), and NK cells (CD56+). Healthy B cells (CD5−/CD19+) were excluded from the analysis due to very small populations. Error bars represent the mean ± SEM. (B) Detailed analysis of the T cell subsets. The dashed line represents the >10% CD4+ T cell cutoff we applied in selection of PB biobank samples. Error bars represent the mean ± SEM (n = 24), *P < 0.05, **P < 0.01 (2-way repeated measures ANOVA). (C) CLL sample after spheroid formation. The sample was stained for DAPI (blue), CD4 (green), CD8 (yellow), CD14 (red), and CD19 (magenta) and analyzed by confocal microscopy. (D) CLL samples were stimulated as indicated and cultured in ULA plates for 5 d. Cells were gated based on the following surface markers: CLL (CD5+/CD19+), CD4+ T cells (CD3+/CD4+), CD8+ T cells (CD3+/CD4+), and NK cells (CD56+). Healthy B cells (CD5−/CD19+) were excluded from the analysis due to very small populations. Error bars represent the mean ± SEM (n = 8). CLL = chronic lymphocytic leukemia; IL = interleukin; LN = lymph node; NK = natural killer; PB = peripheral blood; PBMCs = peripheral blood mononuclear cells; ULA = ultra-low attachment.

