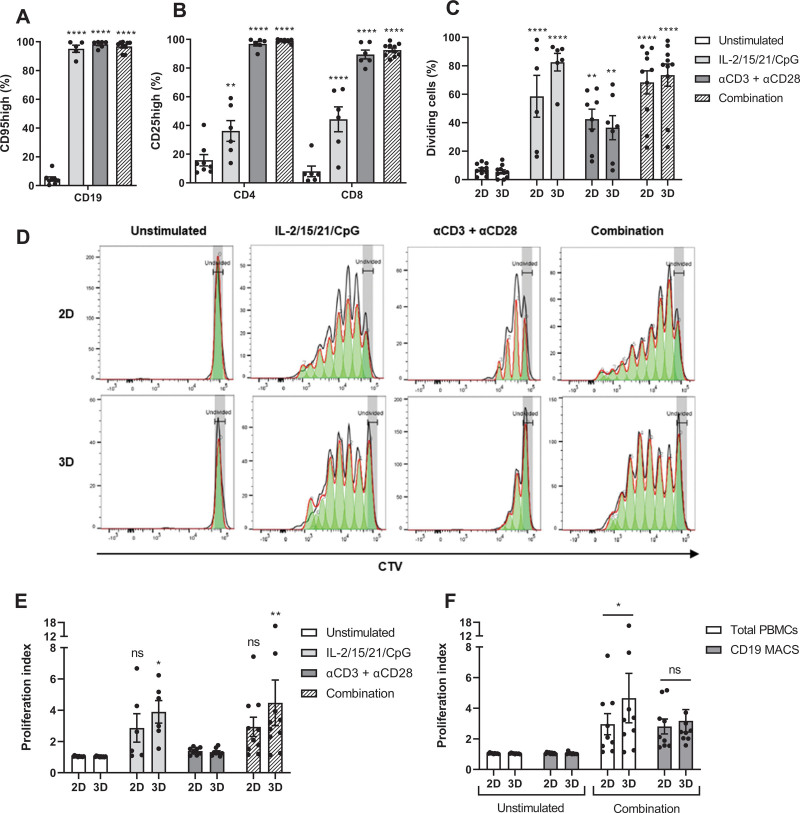
Figure 2.
3D cultures promote CLL proliferation in a T cell-dependent manner. (A and B) CLL samples were stimulated as indicated and cultured in ULA plates for 5 d. Afterwards, cells were measured using flow cytometry with the CD95 activation marker for CLL cells (A) and CD25 as the activation marker for CD4+ or CD8+ T cells (B). Error bars represent the mean ± SEM (n = 6 for IL-2/15/21/CpG; n = 6 for αCD3 + αCD28; n = 10 for combination), **P < 0.01, ****P < 0.0001 ([A]: paired t test; [B]: 2-way ANOVA). Each group was compared with the unstimulated control group. (C–E) CTV-labeled CLL samples were stimulated as indicated and cultured in standard round-bottom 96-well plates (2D) or ULA plates (3D) for 8 d and measured using flow cytometry. Results of the CD5+CD19+ CLL population are shown (C and D). Afterwards, the proliferation index of the CD5+CD19+ CLL population was quantified (E). Bars represent the mean ± SEM (n = 6 for IL-2/15/21/CpG; n = 8 for αCD3 + αCD28; n = 10 for combination), *P < 0.05; **P < 0.01; ****P < 0.0001 (2-way ANOVA). Each group was compared with the unstimulated control group. (F) Stimulation of IL-2/15/21/CpG and αCD3/αCD28 antibodies was performed on the total pool of PBMCs and in parallel on the CD19+ CLL fraction without the presence of T cells. The proliferation index of the CD5+CD19+ CLL population was quantified. Error bars represent the mean ± SEM (n = 9), *P < 0.05 (2-way repeated measures ANOVA). CLL = chronic lymphocytic leukemia; CTV = CellTrace™ Violet; MACS = magnetic-activated cell sorting; PBMCs = peripheral blood mononuclear cells; ULA = ultra-low attachment; 2D = two-dimensional; 3D = three-dimensional.

