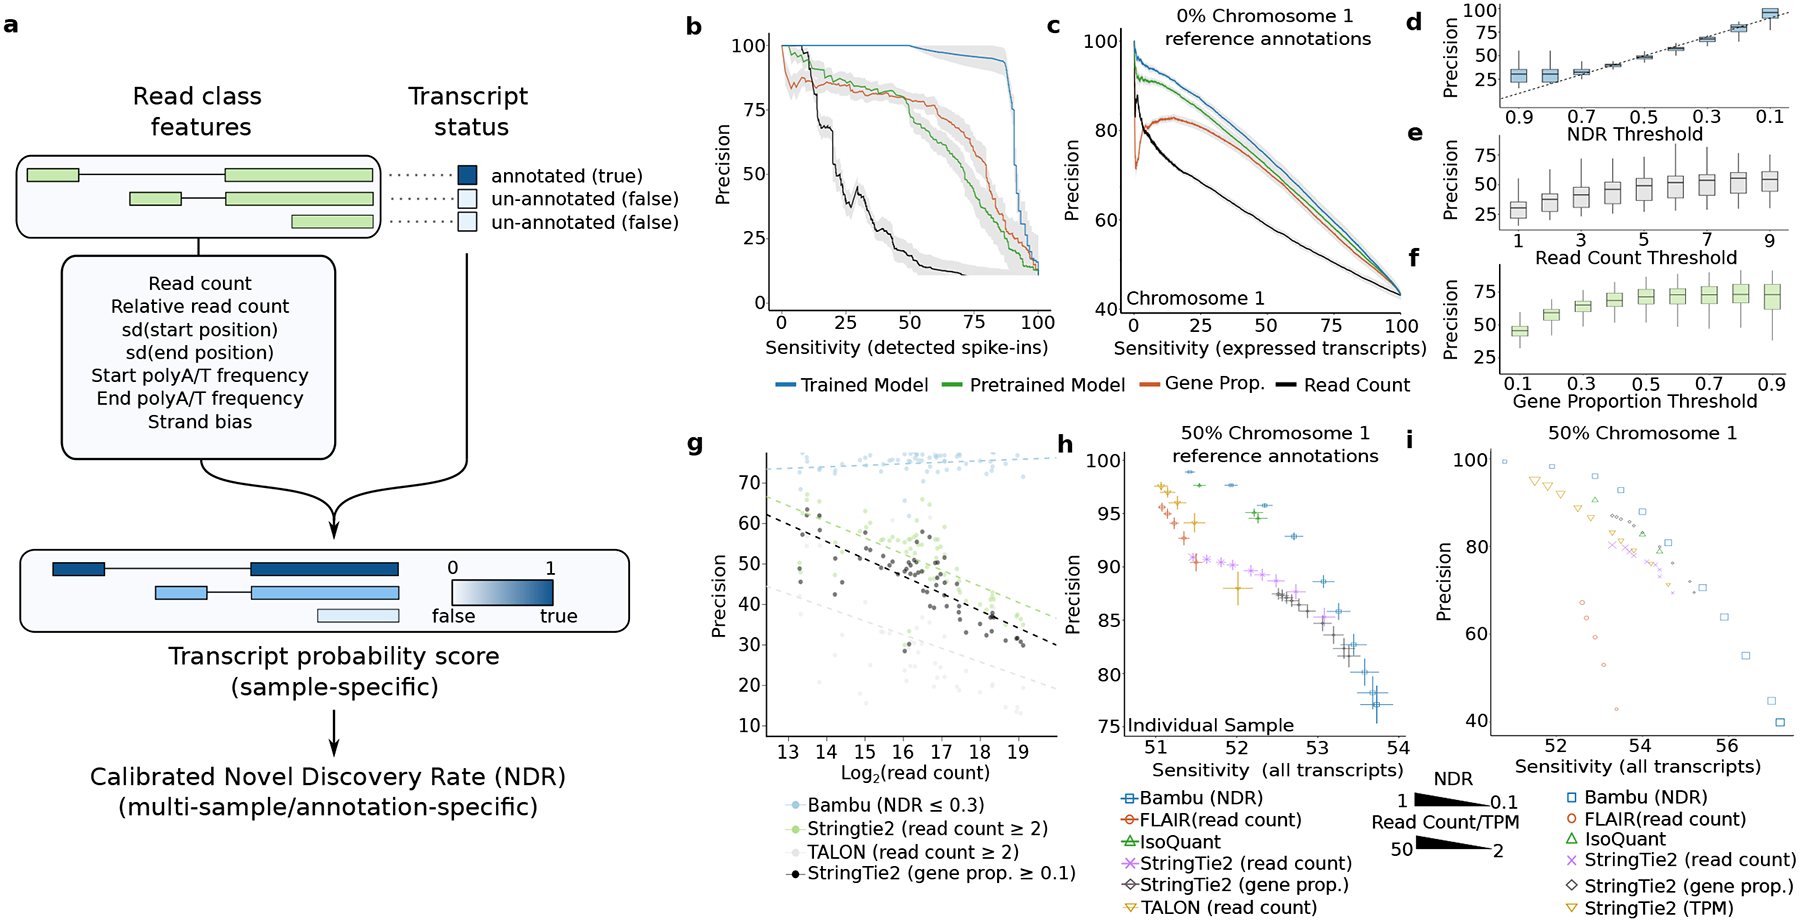
Figure 2. A calibrated machine learning full-length transcript classifier improves transcript discovery accuracy.

(a) The schematic of transcript discovery steps performed by Bambu where 1) a machine learning model is trained on nine different features from read classes features to predict if a read class represents a full-length transcript, 2) the transcript probability score predicted in the first step is re-calibrated to a novel discovery rate across multiple samples (b-c) Average precision recall curves for the performance of transcript discovery for (b) SG-NEx spike-in data (n=8) and (c) all core SG-NEx data (n = 76)The model is evaluated on a (b) subset of the spike-in transcripts or (c) chromosome 1 after being trained on the other transcripts (blue), predictions from the generic model (green), or when read count (black) or gene proportion (red) is used alone as a classifier. The grey shaded area represents the mean +/− SE of the precision for each line. Sensitivity is measured as the percentage of all detected known transcripts. (d-f) Boxplot of the precisions of chromosome 1 read classes passing varying (d) NDR, (e) Read Count and (f) Gene Proportion thresholds across all core SG-NEx data (n = 76) all SG-NEx samples. (g) Each dot colour triplicate represents the precision from the same SG-NEx sample processed by either: Bambu with a NDR threshold of 0.3 (blue), StringTie2 with a read coverage threshold of 2 (green), TALON with a read count threshold of 2 (grey) and StringTie2 with a gene proportion threshold of 0.1 (black). Dotted lines represent a fitted linear regression for each tool (h-i) The average sensitivity and precision on (h) core SG-NEx samples (n = 76) and (i) when combining HepG2 SG-NEx samples (n=14) with 50% of human chromosome 1 annotations randomly removed. Each tool is displayed at several different parameter thresholds: Bambu (blue) with NDR thresholds, FLAIR (red), Stringtie 2 (purple) and (h) TALON (yellow) with read count/coverage thresholds. StringTie2 was also run with gene proportion thresholds (black) and (i) a varying TPM threshold (yellow). IsoQuant (green) points are run with varying “--model_construction_strategy”. Error bars represent the mean +/− SD of the sensitivity and precision.
