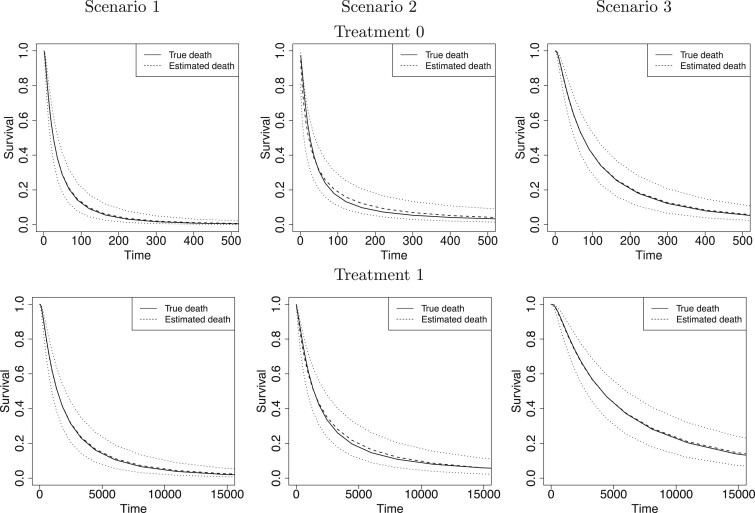
Fig. 1.
For each simulation scenario and by treatment group (first and second rows refer to treatments 0 and 1, respectively), the true survival functions (solid line), the posterior mean survival functions averaged over simulated data sets (dashed line), and 95% point-wise credible intervals (computed using quantiles) averaged over simulated data sets (dotted lines). Survival times are on the original scale (days).

