. 2023 Aug 23;15(1):2248671. doi: 10.1080/19420862.2023.2248671

Figure 3.

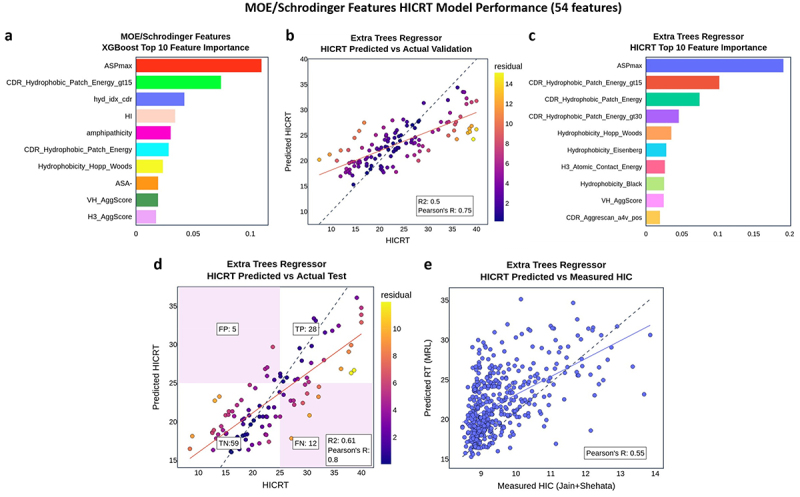
Charts showing the performance of the top HICRT regression model from MOE and Schrödinger features. Top right shows a horizontal bar chart showing the top XGBoost average features in descending order top middle is a scatterplot of the top performing extra trees model with predicted scores versus actual scores for the validation data set. Top left shows a horizontal bar chart of the extra trees regression model in descending order. Bottom right shows a scatterplot of the performance of the top HICRT extra trees regression model on the test data, and shaded areas denote false positive and false negative predictions for HICRT equal to 25 minutes. Bottom left shows a scatter plot of the performance of the top HICRT regression model on the Jain/Shehata data.

HICRT dataset – top model regression performance.

(a) Top ten XGBoost feature importance by average over 160K models. (b) HICRT top model regression performance on validation data. (c) Top ten feature importance for best performing extra trees regression model. (d) Top HICRT extra trees regression model performance on test set data; shaded areas denote false positive (FP) and false negative (FN) classification performance with HICRT = 25 min as cutoff. (e) Top HICRT extra trees regression model performance on Jain/Shehata HIC data.