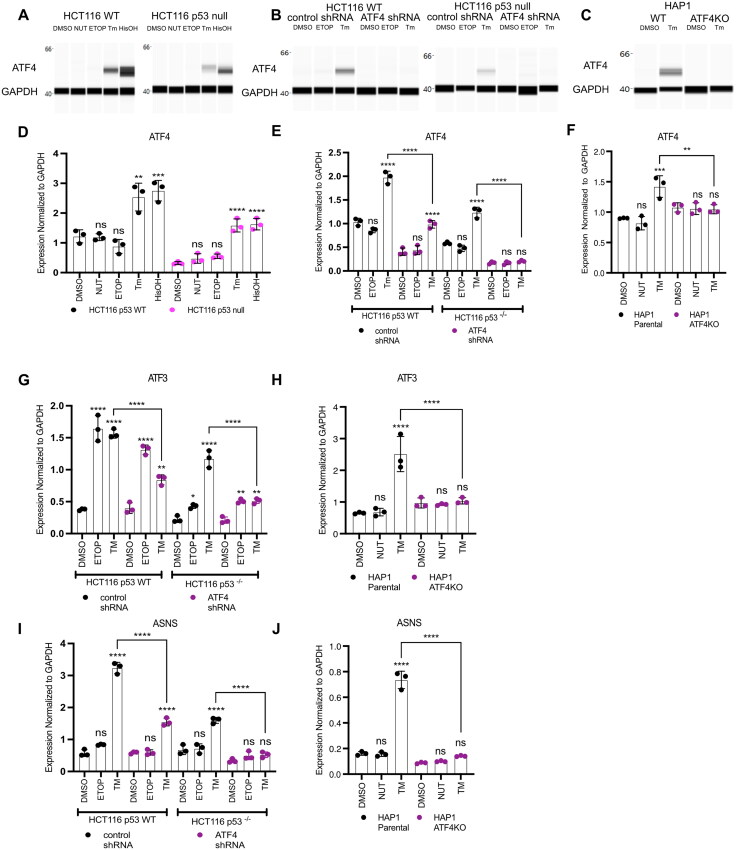
FIG 2.
ATF4 and p53 independently regulate expression of ATF3. ATF4 protein (A to C) and mRNA (D to F) expression analysis by Western blot and qRT-PCR, respectively, in HCT116 WT or p53 null cells (A, D), with shRNA constructs targeting control region (control shRNA) or ATF4 (ATF4 shRNA) (B and E), or HAP1 WT or HAP1 ATF4KO cells (C and F). Gene expression analysis of ATF3 (G and H) or ASNS (I and J) in HCT116 ATF4 shRNA cells (G and I) or HAP1 ATF4KO cells (H and J). Cells were harvested 6 h post-treatment with DMSO, 10 μM nutlin-3A (NUT), 100 μM etoposide (ETOP), 2 μM tunicamycin (TM) or 2 mM histidinol (HisOH). All statistical comparisons were computed using a one-way ANOVA test. *P < 0.05, **P < 0.01, ***P < 0.001, ****P < 0.0001.

