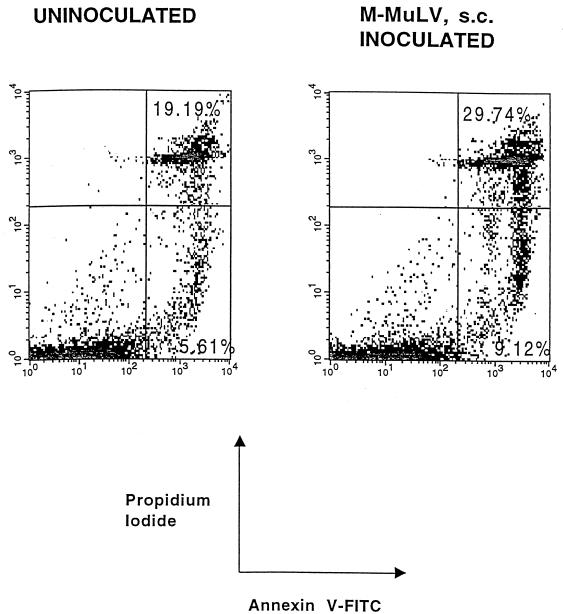
FIG. 2.
Annexin V-PI staining. Thymocytes from the same 6-week-old animals for which results are shown in Fig. 1 were incubated with FITC-conjugated annexin V and PI, and flow cytometric analysis was performed. Percentages of late-stage apoptotic cells (upper right quadrant) and early-stage apoptotic cells (lower right quadrant) are shown. Both FITC-conjugated annexin V and PI fluorescence are plotted on logarithmic scales.

