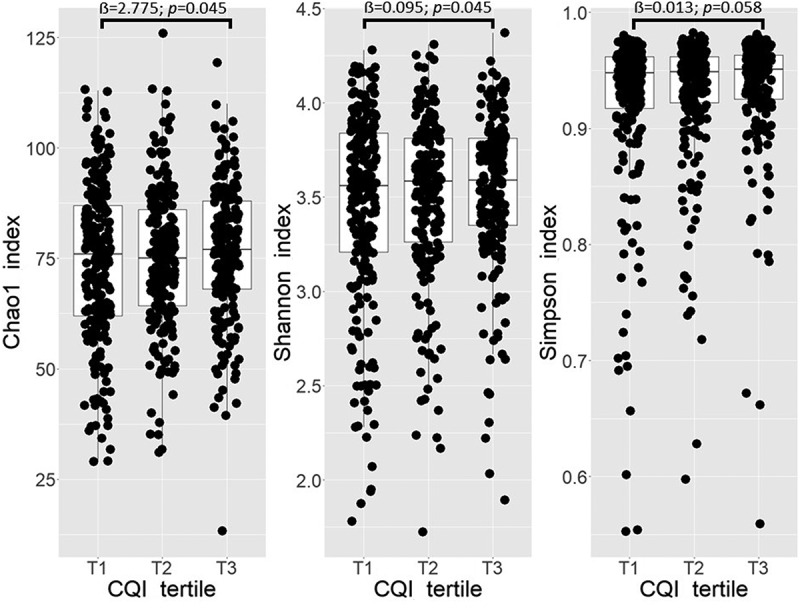
Figure 1.

Boxplots representing the differences in alpha diversity indices Chao1, Shannon, and Simpson across tertiles (T) of baseline CQI. Linear regression was used to test the cross-sectional association between tertiles of baseline CQI and selected indices. Models were adjusted for recruiting center (Alicante, Barcelona, Reus, Valencia), smoking status (former smoker, never smoked, smoker), diabetes status, sex, age categories (below the median, < 65 years old; above the median, > 65 years old). T1 set as reference, p < 0.05 deemed as significant.
