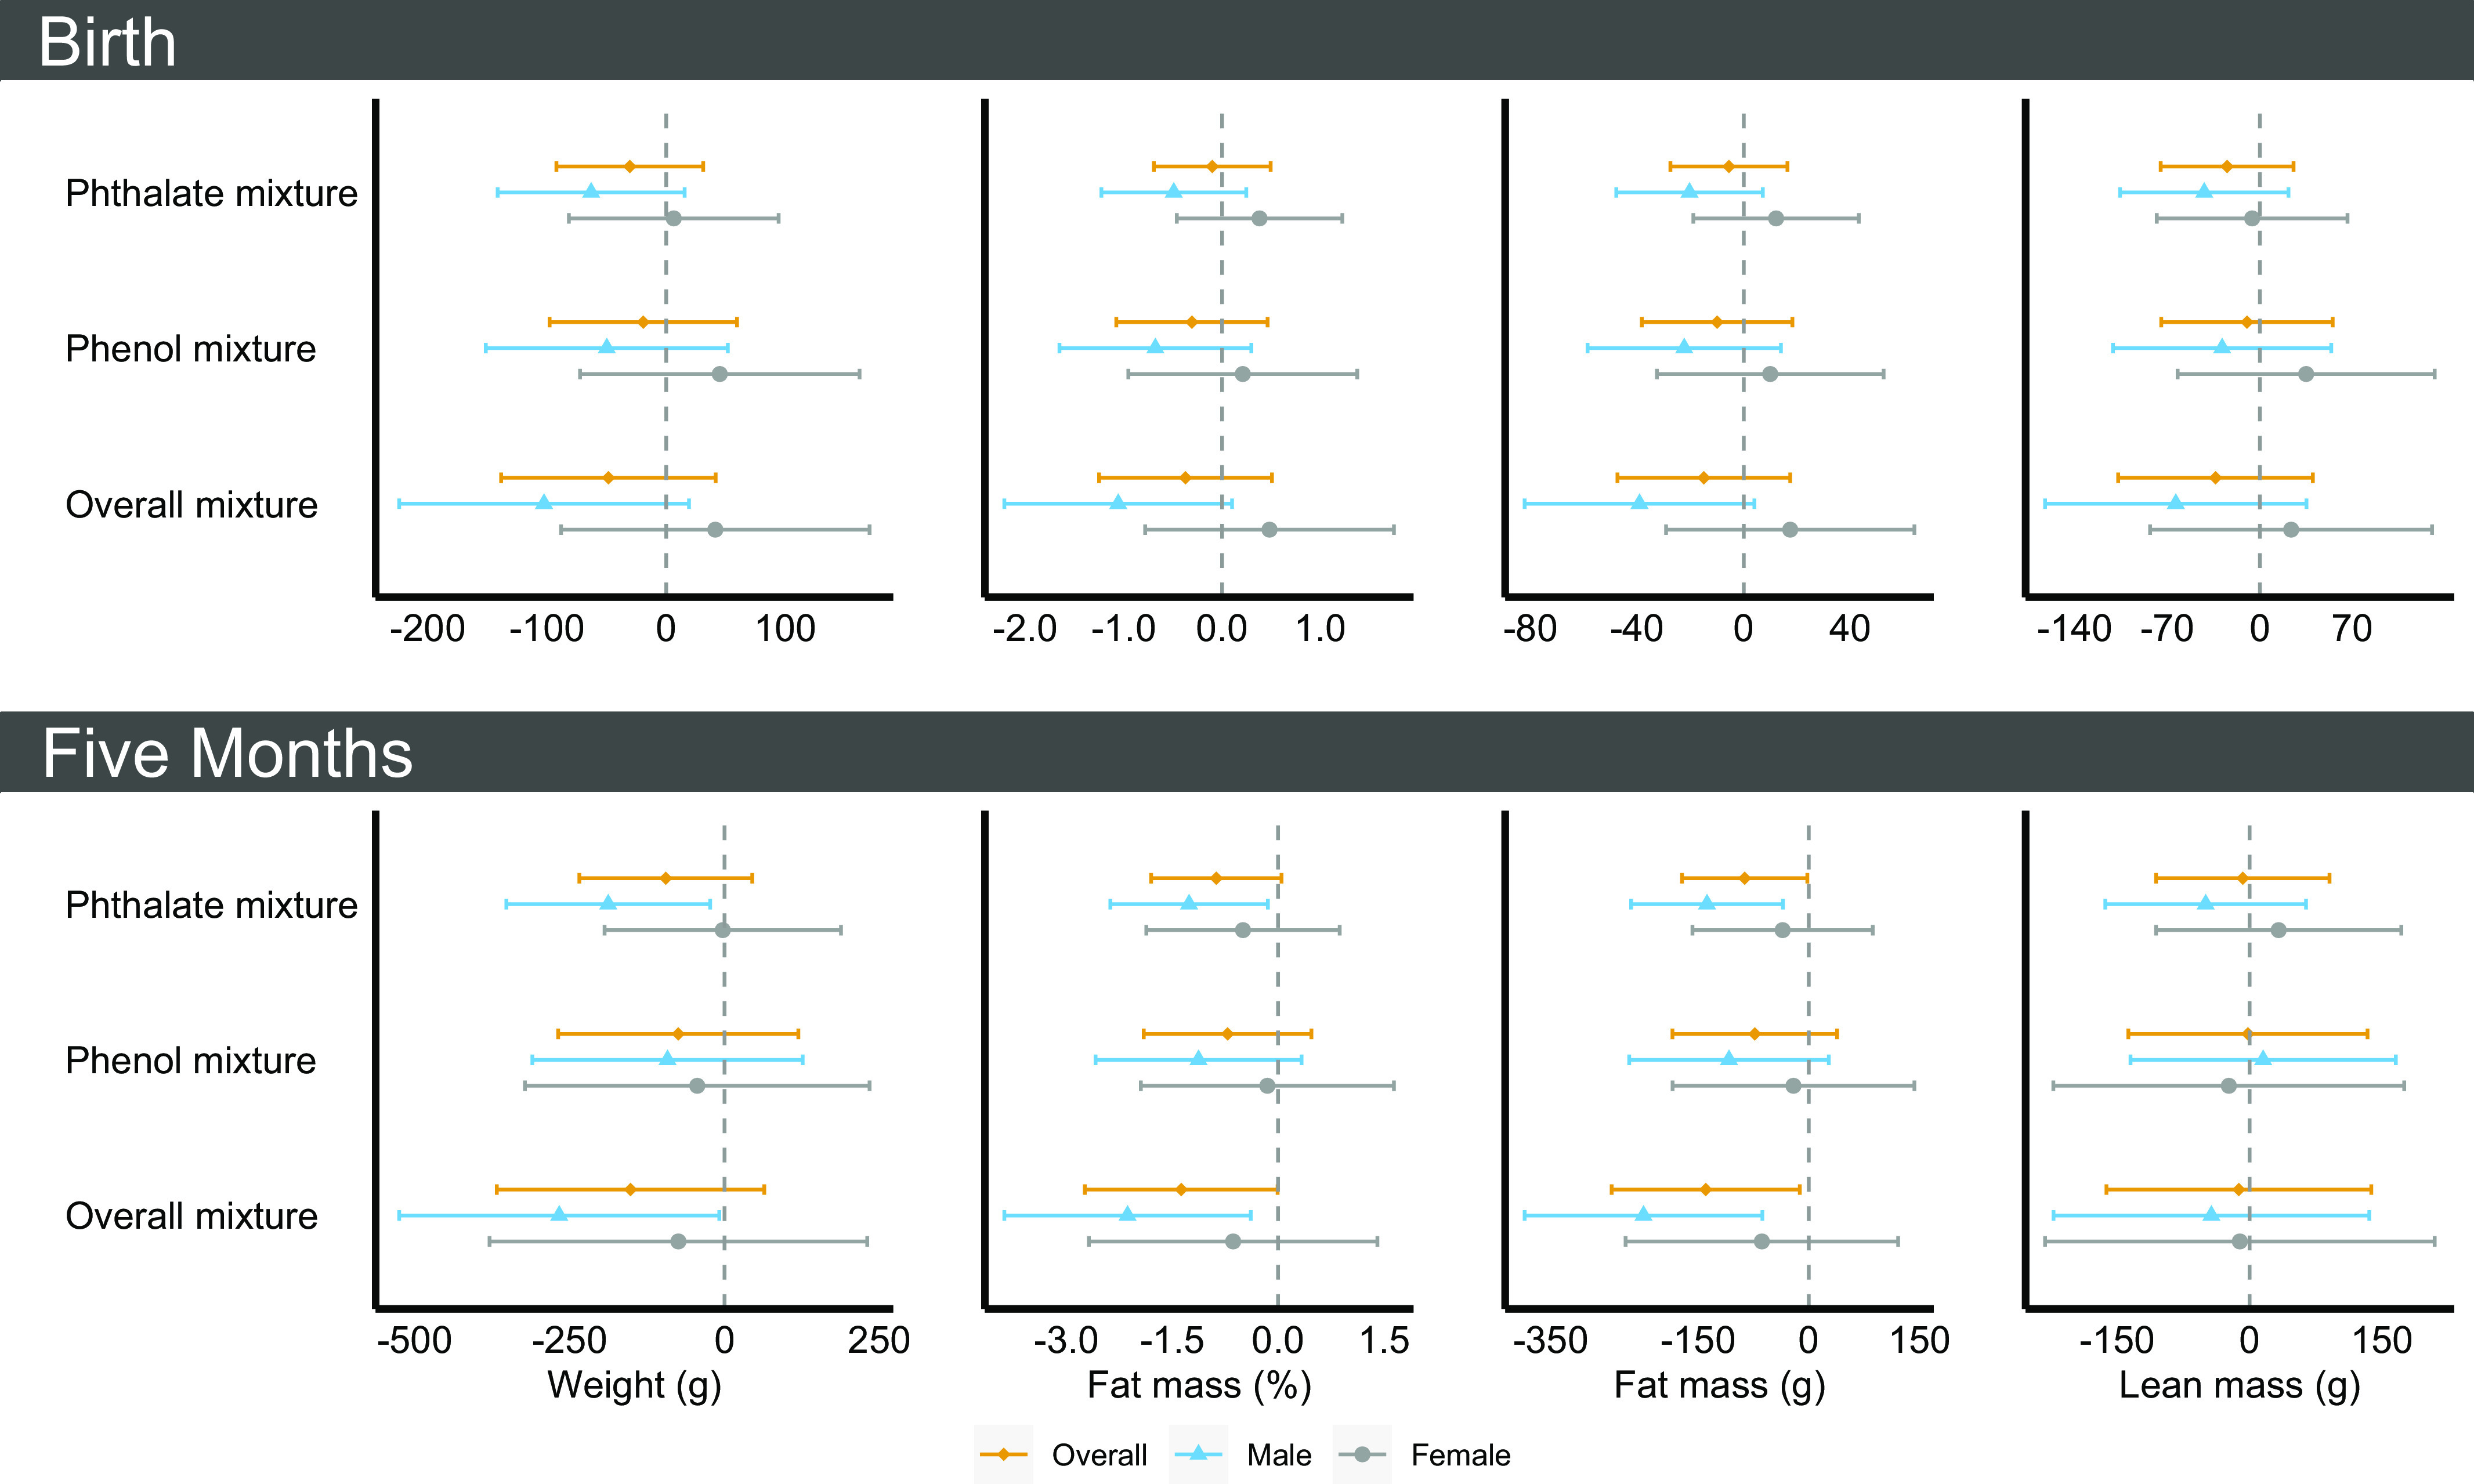
. 2023 Aug 24;131(8):087017. doi: 10.1289/EHP12500

Figure 3.

Figure 3 is a set of eight forest plots. On the top, the four forest plots are titled Birth, plotting Overall mixture, Phenol mixture, and Phthalate mixture (y-axis) across weight (grams), ranging from negative 200 to 100 in increments of 100; fat mass percentage, ranging from negative 2.0 to 1.0 in increments of 1.0; fat mass (grams), ranging from negative 80 to 40 in increments of 40; and lean mass (grams), ranging from negative 140 to 70 in increments of 70 (x-axis) for Overall, Male, and Female. At the bottom, the four forest plots are titled Five months, plotting Overall mixture, Phenol mixture, and Phthalate mixture (y-axis) across weight (grams), ranging from negative 500 to 250 in increments of 250; fat mass percentage, ranging from negative 3.0 to 1.5 in increments of 1.5; fat mass (grams), ranging from negative 350 to 150 in increments of 150; and lean mass (grams), ranging from negative 150 to 150 in increments of 150 (x-axis) for Overall, Male, and Female.

Multipollutant model results [β (95% CI)] per 1-quartile increase in creatinine-standardized midpregnancy phthalate or phenol biomarker concentration with infant size and body composition at birth and at 5 months of age overall and by infant sex in the analytic sample (n=438), Healthy Start cohort, 2009–2014. Models were adjusted for age, race and ethnicity, prepregnancy body mass index category, highest education level completed, any previous pregnancies, smoking during pregnancy, gestational age at biological sample collection, infant sex, diet during pregnancy, physical activity during pregnancy, and gestational weight gain. In models for infant outcomes at the 5-month follow-up, we additionally adjusted for infant age. See Tables S13 and S14 for more details. Note: CI, confidence interval.