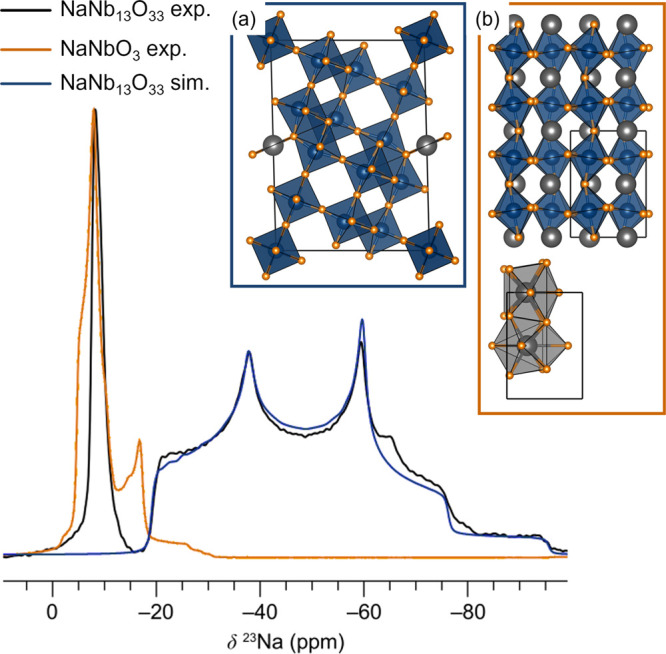
Figure 2.

23Na MAS NMR of 1-NNO featuring two distinct resonances (black curve): a fit of the quadrupolar environment with a center of mass at approximately −50 ppm (blue curve) and an overlaid experimental spectrum of NaNbO3 (orange curve). Spectra were acquired at room temperature at 9.4 T and 12.5 kHz MAS. Box (a) shows the NaNb13O33 structure with its square-planar Na environment, which is assigned to the strongly quadrupolar line shape, while box (b) shows the Na environments in NaNbO3. Grey spheres and polyhedra correspond to sodium, blue octahedra are NbO6.
