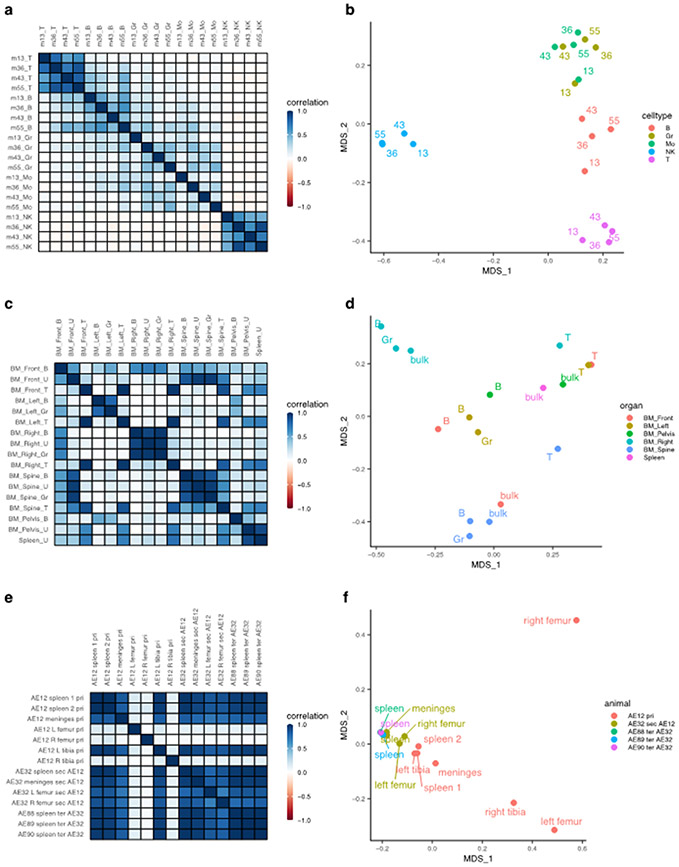
Figure 2: Global clonal distributions.
(a) Pairwise Pearson correlation plots between longitudinal samples from the Six dataset. Row and column labels indicate months post-transplant (m) and cell type (T, T cell; B, B cell; Gr, Granulocyte; Mo, Monocyte; NK, Natural Killer cell). (b) Bray-Curtis dissimilarity indices between samples from the Six dataset, grouped by cell type and labeled based on months post-transplant. The x and y-axis represent the two main axes of variation after conducting principal coordinate analysis on the Bray-Curtis measures of dissimilarity (MDS). (c) Pairwise Pearson correlation plots between samples from different anatomical sites of a single transplanted mouse at euthanasia from the Belderbos dataset. Row and columns labels describe the anatomical site (BM, Bone Marrow) followed by the cell type (B, B cell; U, Unsorted samples; T, T cell; Gr, Granulocyte). (d) Bray-Curtis dissimilarity indices between samples from the Belderbos dataset grouped by the anatomical site and labeled by cell type. (e) Pairwise Pearson correlation values between samples of the same set of serial xenograft transplants from the Elder dataset. Row and column labels describe the animal code (e.g. AE12), followed by the anatomical site, then the serial transplant designation (pri, Primary; sec, Secondary, ter, Tertiary), followed by the donor animal code if it is a sec or ter sample. AE12 is the primary recipient of ALL blast cells, AE32 is the secondary recipient receiving cells from the primary animal AE12, and AE88, AE89, AE90 are tertiary recipients receiving cells from AE32. (f) Bray-Curtis dissimilarity indices between samples from the Elder dataset colored by the mouse of origin and labeled by the anatomical site.

