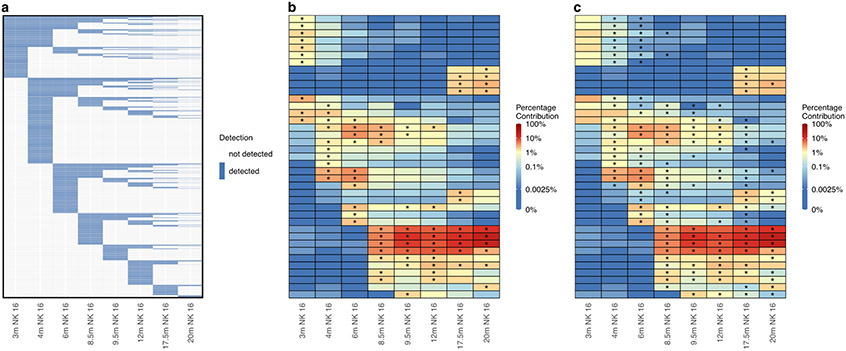
Figure 4: Longitudinal clonal patterns.
(a) Binary heat map showing the presence (blue) or absence (white) of 11,799 individual clones detected at a proportion of 0.01% or greater in at least one NK cell sample from the Wu dataset. Columns represent samples and rows represent individual clones ordered by their first time point of detection. (b) Heat map showing the log normalized counts of the top ten clones from each NK cell sample from the Wu dataset. Overlaid asterisks indicate which clone is one of the top ten contributing clones for each sample, and clones are ordered on the y-axis based on hierarchical clustering of their Euclidean distances between their log normalized counts across samples. (c) Heat map depicting the same log normalized count values as in (b) but with overlaid asterisks instead indicating which clones significantly changed in proportion from the previous sample based on a p-value of < 0.05 assessed by a chi-squared test of proportions with Bonferroni adjustment of p-values to account for multiple comparisons. m, months post-transplant; NK 16, CD3-CD14-CD20-CD56-CD16+ NK cells.

