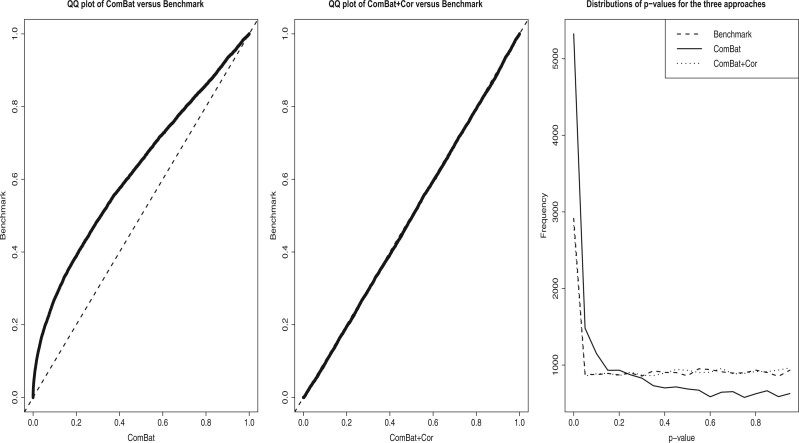
Fig. 1.
Three figures are used to illustrate that ComBat+Cor reduces the exaggerated
significance seen when ComBat is applied based on simulated data that mimics the
bladderbatch experimental design. Note that the original
bladderbatch data has unbalanced group-batch design and small (mean
and variance) batch effects. The benchmark approach refers to the approach that
applies ordinary differential expression analysis to data without any batch effects.
(a) QQ plot of p-values using ComBat and the
p-values using the benchmark approach. The line falls above the
 identity line, suggesting that
p-values generated by ComBat concentrate at smaller values than
those generated on the data without batch effect. (b) QQ plot of
p-values using ComBat+Cor (
 ) and
p-values using the benchmark approach. (c) line chart comparing the
distributions of p-values using ComBat, ComBat+Cor, and the benchmark
approach.

