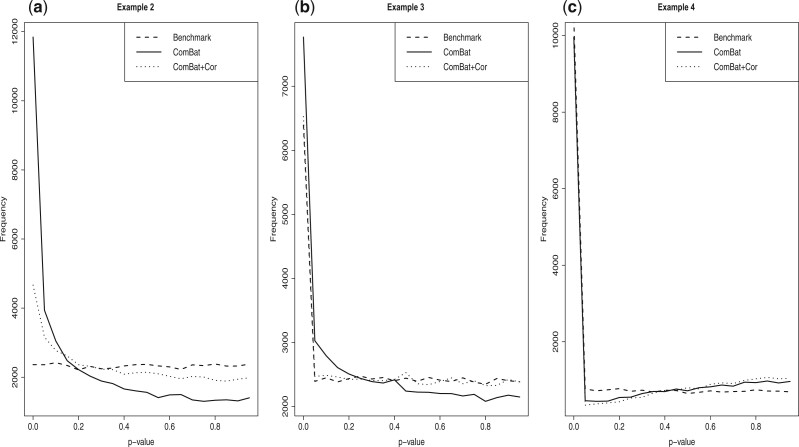
Fig. 4.
Simulation results for examples 2, 3, and 4. In each plot, we illustrate the distributions of the p-values for the benchmark approach, ComBat, and ComBat+Cor. (a) Simulation results based on Towfic and others (2014). (b) Simulation results based on Johnson and others (2007). (c) Simulation results based on the TB data for comparing progressors versus nonprogressors.

