

Abstract
The mitochondrial calcium uniporter (MCU) mediates uptake of calcium ions (Ca2+) into the mitochondria, a process that is vital for maintaining normal cellular function. Inhibitors of the MCU, the most promising of which are dinuclear ruthenium coordination compounds, have found use as both therapeutic agents and tools for studying the importance of this ion channel. In this study, six Co3+ cage compounds with sarcophagine-like ligands were assessed for their abilities to inhibit MCU-mediated mitochondrial Ca2+ uptake. These complexes were synthesized and characterized according to literature procedures and then investigated in cellular systems for their MCU-inhibitory activities. Among these six compounds, [Co(sen)]3+ (3, sen = 5-(4-amino-2-azabutyl)-5-methyl-3,7-diaza-1,9-nonanediamine) was identified to be a potent MCU inhibitor, with IC50 values of inhibition of 160 and 180 nM in permeabilized HeLa and HEK293T cells, respectively. Furthermore, the cellular uptake of compound 3 was determined, revealing moderate accumulation in cells. Most notably, 3 was demonstrated to operate in intact cells as an MCU inhibitor. Collectively, this work presents the viability of using cobalt coordination complexes as MCU inhibitors, providing a new direction for researchers to investigate in future studies.
Keywords: Bioinorganic chemistry, Cobalt, Inhibitors, Calcium, Cage compounds
Graphical Abstract

In this work, the ability of cobalt(III) cage complexes to inhibit mitochondrial calcium uptake was assessed. This study identifies a new cobalt-based inhibitor that can operate in intact cells, adding to the previously reported ruthenium- and osmium-based complexes that also possess this property.
Introduction
The important role of mitochondrial calcium ions (mCa2+) in cellular signaling and bioenergetic processes is widely recognized.1–3 Entry of these ions into the mitochondria is mediated by the highly selective transmembrane channel known as the mitochondrial calcium uniporter (MCU).4–6 Its structure, elucidated recently,7,8 consists of a tetrameric assembly of the pore-forming MCU subunit associated with the regulatory EMRE,9 MICU1,10 and MICU211 domains. Overload of mCa2+ through the MCU has been implicated in several pathophysiological conditions, including neurodegenerative disorders12–15, heart disease,16–18 cancer,19,20 cystic fibrosis,21,22 and ischemia-reperfusion injury.23 This connection has prompted extensive efforts in recent years to develop chemical inhibitors of the MCU to prevent mCa2+ overload.24 Consequently, several organic25–30 and inorganic31–39 compounds with MCU-inhibitory activity have been discovered.
Among these compounds, Ru265, a dinuclear nitrido-bridged ruthenium complex, is currently one of the most potent MCU inhibitors reported, with nanomolar inhibitory activity in permeabilized cells.35 An important property of Ru265 is its ability to inhibit MCU-mediated mCa2+ uptake in intact cells, a feature that is not shared by other reported inhibitors. Building upon the success of Ru265, new derivatives of this compound have recently been reported. For example, the dinuclear osmium analogues, called Os245 and Os245′, are also cell permeable and inhibit the MCU with a similar potency as Ru265.39 In addition, modifying Ru265 with different axial ligands affords compounds with a comparable ability to operate in non-permeabilized cells.37 Collectively, these studies have demonstrated Ru265 and its analogues to be a highly promising class of MCU inhibitors. A potential limitation for their more widespread use, however, arises from the relatively expensive cost of Ru and Os, as well as concerns about introducing these non-endogenous metal ions into biological systems.
In this context, it has been noted that coordination complexes of the first-row transition metal cobalt can also possess MCU-inhibitory activity.33,36,40 In contrast to Ru, Co is a naturally present within biological systems and is significantly less expensive. Thus, despite the lower potency of these compounds, these advantages suggest that a continued exploration of Co3+ compounds as MCU inhibitors is warranted. In this work, we present our investigation of Co3+ cage complexes as MCU inhibitors. These sarcophagine-like ligands, originally developed by Sargeson,41 provide a robust and full encapsulation of metal ions, forming highly stable complexes that can be leveraged for different biological applications.42 Our prior studies demonstrated that simple Co3+ ammine complexes are MCU inhibitors, but were ineffective in intact cell systems.36 We hypothesized that the corresponding cage compounds would possess similar inhibitory properties but benefit from a greater stability afforded from the encapsulating ligands. The results presented in this report provide verification for this hypothesis and expand the library of Co3+ complexes that can be used as inexpensive and accessible tools for studying mCa2+ uptake dynamics.
Results and Discussion
A small set (Figure 1) of Co3+ cage complexes, namely [Co(diNOsar)]3+ (1, diNOsar = dinitro-3,6,10,13,16,19-hexaazabicyclo[6.6.6]eicosane), [Co(diAMsar)]3+ (2, diAMsar = diamino-3,6,10,13,16,19-hexaazabicyclo[6.6.6]eicosane), [Co(sen)]3+ (3, sen = 5-(4-amino-2-azabutyl)-5-methyl-3,7-diaza-1,9-nonanediamine), [Co(MeNOsar)]3+ (4, MeNOsar = methyl-nitro-3,6,10,13,16,19-hexaazabicyclo[6.6.6]eicosane), [Co(CO2Et,Mesar)]2+ (5, CO2Et,Mesar = 1-ethylcarboxy-8-methyl-2-oxo-3,6,10,13,16,19-hexaazabicyclo[6.6.6]icosanato), and [Co(CO2H,Mesar)]2+ (6, CO2H,Mesar = 1-carboxy-8-methyl-2-oxo-3,6,10,13,16,19-hexaazabicyclo[6.6.6]icosanato), were synthesized, purified, and characterized following literature procedures.41,43,44 These complexes were chosen because they bear different overall charges and contain different substituents on the sarcophagine-like ligands that could be used to understand and develop structure-activity relationships for this class of compounds.
Figure 1.

Chemical structures of Co3+ cage complexes investigated in this study.
Prior to assessing their MCU-inhibitory activities, the cytotoxicity of 1–6 in both HeLa and HEK293T cells was determined via the colorimetric thiazolyl blue tetrazolium bromide (MTT) assay. The treatment of these cells with increasing concentrations of the compounds for a 72 h time period revealed them, with the exception of 2, to be minimally cytotoxic, as reflected by cell viabilities that remained greater than 80% for concentrations lower than 1 mM (Figures S1–S2, SI). Compound 2, by contrast, was moderately cytotoxic under these conditions, reducing cell viability to 40% when administered at a concentration of 1 mM. Overall, the lack of cytotoxicity of these compounds supports their further use as potential MCU inhibitors.
Compound 1 was evaluated for its mCa2+ uptake inhibitory properties in digitonin-permeabilized HeLa cells incubated with the Ca2+-responsive fluorescent indicator Calcium Green-5N.45 A 25 μM concentration of 1 led to 85% mCa2+ uptake inhibition compared to untreated cells. Given this promising result, we next examined the other five Co3+ cage compounds. Compound 2 at this concentration showed no inhibitory activity. Based on its moderate cytotoxicity and inability to inhibit the MCU, we did not carry out any further studies with this complex. The MCU inhibitory activity of a solution of 25 μM of 4 was comparable to that of 1, whereas 5 and 6 inhibit <50% of the mCa2+ uptake at this concentration. By contrast, 3 was able to completely abolish mCa2+ uptake at 25 μM (Figure 2).
Figure 2.
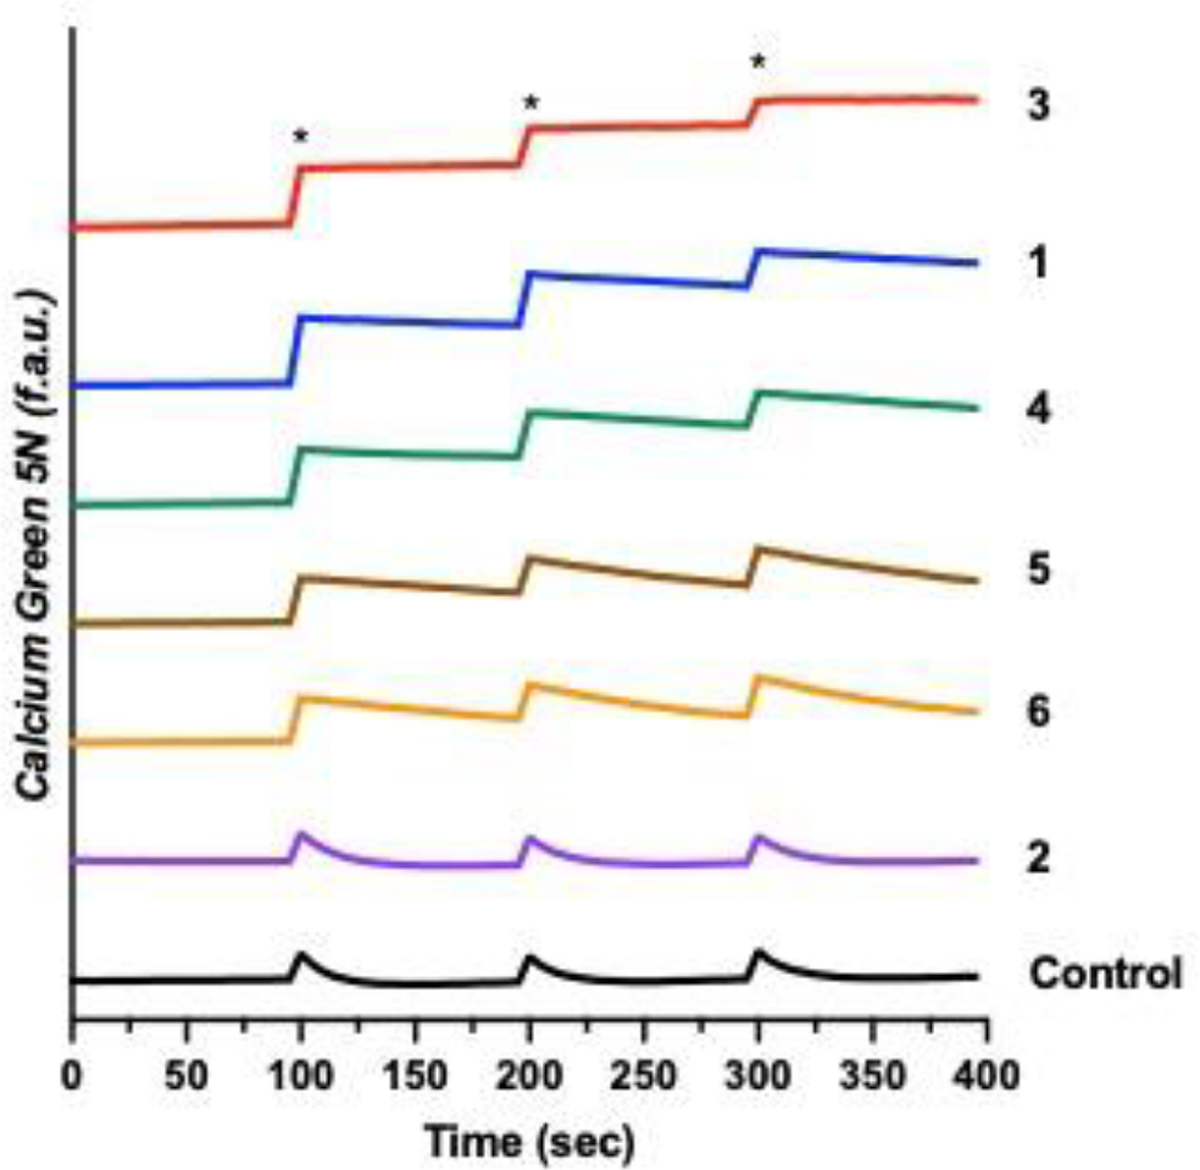
Cytosolic Ca2+ transients in the presence or absence of 1–6 (25 μM) measured with the cytosolic Ca2+ dye Calcium Green-5N in permeabilized HeLa cells (5 × 10⁶ cells mL−1). CaCl2 (10 μM) additions are indicated by an asterisk (*).
To further quantify the relative potencies of these Co3+ complexes compared to the previously reported Ru-, Os-, and Co-based MCU inhibitors, dose-response studies assessing the mCa2+ uptake inhibitory properties in permeabilized HeLa and HEK293T cells were carried out (Figures S3–S6, SI). The 50% mCa2+ uptake inhibitory concentration (IC50) values for 1–6, Ru265, Os245, Os245ʹ, and [Co(en)3]3+ (en = ethylenediamine) are given in Table 1. Consistent with our single-dose studies, compound 3 is the most potent compound in this library as reflected by IC50 values 160 and 180 nM in HeLa and HEK293T, respectively. Notably, these values are still an order of magnitude larger than those for Ru265 and Os245ʹ, indicating that the high potency of these compounds is not yet achieved with a simple mononuclear Co3+ complex. Compared to a previously identified Co-based MCU inhibitor [Co(en)3]3+, 3 is only slightly less potent. In comparing the structures of 3 and [Co(en)3]3+ to those of 1, 2, and 4–6, a common feature of potent MCU inhibitors is the presence of the coordinated secondary amine RNH2 groups. Thus, it appears that this type of coordination motif is preferential for MCU-inhibitory activity of Co3+ complexes. Site-directed mutagenesis studies and molecular docking simulations have previously suggested that these amine groups are responsible for hydrogen-bonding interactions with the DXXE motif of the MCU pore.36 It is likely that the complexes investigated in this work also interact with same motif to modulate MCU activity, but further studies are needed to verify this possibility. We hypothesize, however, that 3 is the most potent inhibitor because it possesses more hydrogen bond donors, particularly in the form of the secondary RNH2 groups. The other complexes, less potent MCU inhibitors, only possess tertiary R2NH groups. These results suggest that the hydrogen-bonding amine groups are a key feature of effective MCU inhibitors. Furthermore, the dinuclear complexes Ru265 and Os245, with ammine NH3 ligands, demonstrate the greatest MCU inhibitory activity, whereas the 10-fold less potent [Co(en)3]3+ and 3 contain secondary RNH2 groups.
Table 1.
mCa2+ uptake inhibition IC50 values of previously reported inhibitors and 1–6 in permeabilized HeLa cells (5 × 10⁶ cells mL−1) and HEK293T cells (1 × 10⁷ cells mL−1)
| Complex | IC50 HeLa (nM) | IC50 HEK293T (nM) |
|---|---|---|
|
| ||
| Ru265[a] | 3.9 ± 1 | 8.6 ± 2.2 |
| Os245[b] | 103 ± 30 | - |
| Os245′[b] | 2.3 ± 0.8 | - |
| [Co(en)3]3+ [a] | 115 ± 13 | 76 ± 10 |
| [Co(diNOsar)]3+ (1) | 6050 ± 480 | 7980 ± 370 |
| [Co(diAMsar)]3+ (2) | >25000 | >25000 |
| [Co(sen)]3+ (3) | 160 ± 20 | 180 ± 20 |
| [Co(MeNOsar)]3+ (4) | 2910 ± 260 | 2730 ± 200 |
| [Co(CO2Et,Mesar)]2+ (5) | >25000 | >25000 |
| [Co(CO2H,Mesar)]2+ (6) | >25000 | >25000 |
Based on the high efficacy of 3 as an MCU inhibitor, we evaluated its properties in intact, non-permeabilized cells. To first verify that 3 does not negatively affect mitochondrial function, we carried out the JC-1 assay to assess the integrity of the mitochondrial membrane potential of eukaryotic cells upon exposure to 3. The 24 h treatment of both HeLa and HEK293T cells with 50 μM 3 did not lead to depolarization of the mitochondrial membrane potential, indicating that this compound is a strong candidate for use in intact cell systems (Figures S7–S9, SI).
The ability of 3 to be internalized by non-permeabilized cells was investigated next. Ru265, its derivatives, and Os245 are able to inhibit MCU-mediated mCa2+ uptake in intact HeLa cells,35,37,39 but conversely, [Co(en)3]3+ is not. This latter result was somewhat surprising, given that cells treated with [Co(en)3]3+ take up significant quantities of Co, as determined by graphite furnace atomic absorption spectroscopy (GFAAS).36 In the context of these somewhat paradoxical results, the uptake of 3 and [Co(en)3]3+ by HeLa and HEK293T cells was assessed by treating both cell lines with 50 μM of the complexes at 37 °C for 3 h. We then collected the cells and measured the Co content using GFAAS. The data were normalized to the protein content of the cell suspensions using the bicinchoninic acid (BCA) assay. As shown in Figure 3, both 3 and [Co(en)3]3+ are taken up at comparable levels in both HeLa and HEK293T cells. Cellular fractionation studies of HeLa cells treated with 3 show equal concentrations of this compound in the mitochondria and extramitochondrial fractions, indicating that this compound does access the mitochondria, but does not accumulate there (Figure S10, SI), consistent with previously reported data for [Co(en)3]3+.36 These results are in contrast those of Ru265 and Os245, where accumulation of these compounds in the mitochondria is reflected by higher concentrations measured within this organelle compared to the extramitochondrial fractions.35,39
Figure 3.

Measurement of cobalt in (a) HeLa cells and (b) HEK293T cells that had been treated with [Co(en)3]3+ or 3 (50 μM) for 3 h at 37 °C. The data is reported as the mean pg of Co normalized to the μg of protein present in each cell suspension ± SD (n = 3), ns = not significant.
The successful uptake of 3 by both HeLa and HEK293T cells suggested that this complex could also inhibit MCU-mediated mCa2+ uptake in intact cells. To investigate this possibility, we incubated HeLa cells with 50 μM 3, as well as Ru265 and [Co(en)3]3+, for 2 h at 37 °C. The cells were then treated with the mitochondria-localizing Ca2+ sensor Rhod 2-AM and imaged by confocal fluorescence microscopy. To induce MCU-mediated mCa2+ uptake, histamine (100 μM) was added to the cells, and the fluorescence was recorded over time (Figure 4). The data are presented as background-corrected fluorescence over the time course of the experiment. Consistent with prior studies, Ru265 is able to significantly diminish mCa2+ uptake under these conditions, whereas [Co(en)3]3+ cannot. Within cells treated with 3, however, a statistically significant decrease in mCa2+ uptake was observed. This result is in stark contrast to other previously investigated Co3+ compounds, like [Co(en)3]3+, which were only effective in permeabilized cell systems.36 Although Ru265 is more potent in both permeabilized and intact cells, compound 3 is the first reported Co3+ compound to show MCU-inhibitory activity in intact cell systems.
Figure 4.

(a) Mean fluorescence response of cells treated with 0 or 50 μM Ru265, [Co(en)3]3+, or complex 3. Data are presented as the mean normalized fluorescence (F/F0) ± SD of at least seven individual cells per replicate. (b) Fold increase (F/F0) of each treatment upon addition of histamine. Data are presented as the mean increase in response ± SD of at least seven individual cells per replicate (n = 3), ***p < 0.005; *p < 0.05; ns = not significant.
Conclusion
In this report, six Co3+ cage complexes bearing sarcophagine-like ligands were assessed for their abilities to inhibit MCU-mediated mCa2+ uptake. From this study, 3 was identified to be a nanomolar inhibitor in permeabilized cells. The inhibitory activity of 3 is similar to that of the previously investigated Co3+ complex,36 [Co(en)3]3+, but poorer than those of Ru26535 and Os245′.39 Notably, the more facile synthesis of 3, compared to Ru265 and Os245, may make this compound desirable for its use as an MCU inhibitor. Cellular accumulation studies with GFAAS demonstrated moderate uptake of 3 into HeLa and HEK293T cells, comparable to [Co(en)3]3+. A key characteristic of compound 3 that is unique to other Co3+ complexes investigated is its ability to inhibit MCU-mediated mCa2+ uptake in intact cell systems, a property shared with Ru26535 and its derivatives,37 as well as Os245.39 The fact that [Co(en)3]3+ exhibits similar uptake as 3 but is not an effective MCU inhibitor under these conditions suggests that additional factors like intracellular localization and decomposition need to be considered when designing new complexes for this application. In any case, the potential use of Co3+ complexes as MCU inhibitors presents new strategies for the development of more cost-affordable and easily synthesized complexes as potential therapeutic agents or tools for studying mCa2+ dynamics.
Experimental Section
All reagents and solvents were obtained commercially and used without further purification. Water (18 MΩ·cm) was purified using an ELGA PURELAB flex 2 (High Wycombe, UK).
Physical Measurements.
All 1D NMR spectra were obtained at 25 °C using a Bruker AV III HD 500 MHz spectrometer equipped with a broadband Prodigy cryoprobe. UV-vis spectra were acquired using a Shimadzu UV-1900 spectrophotometer (Shimadzu, Kyoto, Japan) fitted with a temperature-controlled circulating water bath. Elemental analyses (C, H, N) were carried out by Atlantic Microlab Inc. (Norcross, GA). Fluorescence and absorbance of samples in 96-well plates were measured using a BioTek Synergy HT plate reader (Winooski, VT). GFAAS was performed using a PinAAcle 900Z spectrometer (Perkin Elmer, Waltham, MA). Standard solutions (0–50 ug L−1) of cobalt were used to generate a calibration curve. The concentrations of all cobalt stock solutions applied in analytical and biological experiments were verified by GFAAS. Statistical analyses were performed using GraphPad Prism version 9.4.1 by applying a non-paired student’s t-test. Curve fitting was also performed using GraphPad Prism version 9.4.1.
Synthesis.
Complexes 1–6 were synthesized and characterized according to literature procedures.41,43,44 All compounds were characterized via 1H NMR spectroscopy, UV-vis spectroscopy, and elemental analysis. The measured values matched those reported in the literature.
Cell Lines and Culture Conditions.
HeLa and HEK293T cells were obtained from American Type Culture Collection (ATCC, Washington DC) and cultured at 37 °C as adherent monolayers in a humidified atmosphere containing 5% CO2 in Dulbecco’s Modified Eagle’s Medium (DMEM) containing 4.5 g L1 glucose, L-glutamine, and 3.7 g L1 sodium bicarbonate supplemented with 10% fetal bovine serum (FBS). Cells were tested for mycoplasma contamination bimonthly through the commercial service provided by the Cornell University College of Veterinary Medicine. All reagents and solutions used in biological studies were filtered through a 0.2 μm filter and maintained under sterile conditions.
Cytotoxicity.
HeLa and HEK293T cells were seeded in 96-well plates with ~4000 cells/well and incubated overnight. The following day, the culture media was removed, and cells were treated with media containing varying concentrations of the test complex and incubated for 72 h. The cells were then incubated in DMEM containing 1 mg mL1 MTT without FBS for 3 h. Following incubation, the media was removed, and the purple formazan crystals were dissolved in 200 μL of an 8:1 DMSO/glycine buffer (pH 10) mixture. The average absorbance of control cells was set to 100% viability, and the average absorbances of treated cells were normalized to the control absorbance. Data were plotted as percent viability versus the log[concentration]. The Hill Equation was applied to the data to determine the half maximal inhibitory concentration (IC50). Data are reported as the average of three independent trials ± SD.
Mitochondrial Membrane Potential via JC-1 Assay.
Approximately 1 × 10⁵ HeLa or HEK293T cells were seeded in 35 mm glass-bottomed dishes (MatTek Life Sciences, Ashland, MA) and incubated overnight at 37 °C. The next day, cells were treated with the desired complex (50 μM) and incubated for an additional 24 h at 37 °C. The culture media was removed and replaced with fresh media supplemented with 10 μM JC-1 dye, followed by incubation in the dark for 30 min at 37 °C. The dye-containing media was removed, and the cells were washed with 2 × 1 mL phosphate buffered saline (PBS, Corning Life Sciences). The cells were imaged in 1 mL PBS. Control dishes were handled identically to the treated dishes, sans the positive control dishes, which were treated with PBS supplemented with 50 μM carbonyl cyanide m-chlorophenyl hydrazine (CCCP). The images were collected without the removal of CCCP. Cells were imaged using an EVOS M5000 fluorescence microscope (ThermoFisher, Waltham, MA) with a green fluorescence protein (GFP) filter cube (ex. 457–487/em. 502–538) for the green monomer fluorescence and a Texas red filter cube (ex. 542–582/em. 604–644) for the red J-aggregate fluorescence. The cellular images were analyzed using ImageJ (NIH) and the corrected total cellular fluorescence (CTCF) was calculated using the following formula:
For each replicate, the average red/green fluorescence was determined using at least 8 independent cells and was normalized to untreated control cells ([red/green]control = 1). Data are reported as the average of three independent trials ± SD.
Cell Uptake.
HeLa and HEK293T cells were grown to near confluence in 6-well plates. On the day of the experiment, the culture media was removed, and the cells were treated with fresh media containing 0 or 50 μM complex and incubated for 3 h at 37 °C. The culture media was then removed, and the adherent cells were washed with PBS, detached with 0.05% trypsin + 0.53 mM ethylenediaminetetraacetic acid (EDTA; Corning Life Sciences), and then pelleted by centrifugation (800 × g for 10 min). The cell pellet was suspended in ice cold lysis buffer (1% w/v 3-[3-(cholamidopropyl)dimethylammonio]-1-propanesufonate (CHAPS), 5 mM EDTA, 50 mM tris(hydroxymethyl)aminomethane (Tris), and 100 mM NaCl; pH 7.4). The suspension was vortexed for 30 s and incubated on ice for 45 min. The cell lysate was centrifuged to remove particulates, and the supernatant was transferred to a clean tube. The Co content of the lysate was determined using GFAAS and was normalized to the protein content of the sample, which was determined using the BCA assay kit following manufacturer instructions (ThermoFisher). Results are reported as the average mass ratio of Co to protein (pg/μg) in each sample ± SD.
Mitochondrial Isolation.
Mitochondrial isolation was performed using a protocol that has been previously reported.35,36 Approximately 1 × 10⁶ HeLa cells were seeded in 10 cm2 culture dishes and adhered overnight. Each replicate consisted of cells combined from three 10 cm2 dishes. The next day, cells were treated with 50 μM 3 in normal culture media for 3 h at 37 °C. After this treatment period, the media was removed, cells washed with 3 × 3 mL room temperature PBS, and harvested with trypsin. The cells were pelleted by centrifugation (800 × g) for 10 min and resuspended in 500 μL ice cold mitochondrial isolation buffer (pH 7.4) containing 200 mM mannitol, 68 mM sucrose, 50 mM piperazine-N,N′-bis(2-ethanesulfonic acid), 50 mM KCl, 5 mM ethylene glycol-bis-(β-aminoethyl ether)-N,N,N′,N′-tetraacetic acid (EGTA), 2 mM MgCl2, 1 mM dithiothreitol, and 1:500 v/v protease inhibitor cocktail. The cell suspension was then incubated on ice for 20 min before it was homogenized through a 25-gauge needle using a 1 mL syringe with 40 passes. The homogenized suspension was centrifuged (150 × g) for 5 min, and the supernatant was transferred to a clean tube and centrifuged (14,000 × g) for 10 min to pellet the mitochondrial fraction. The remaining solid from the first centrifugation step was lyophilized overnight before digestion in 300 μL 70% HNO3 (trace metal grade). The mitochondrial pellet was suspended in 300 μL distilled water and sonicated on ice for 30 s. Both suspensions were diluted or supplemented with fresh HNO3 to contain < 2% HNO3 to give the same concentration to account for potential matrix effects. The cobalt concentration of each fraction was measured by GFAAS and normalized to the protein content of the sample using the BCA assay as described above. Results are reported as the mass ratio of total cobalt to protein (pg/μg) in each sample ± SD.
Mitochondrial Ca2+ Uptake in Permeabilized Cells.
HeLa or HEK293T cells were grown to near confluency in a 10 cm2 dish and harvested with trypsin. The cells were pelleted by centrifugation, suspended in cold PBS supplemented with 5 mM EDTA (pH 7.4), and counted using trypan blue. The cells were pelleted again by centrifugation (800 × g) for 5 min and resuspended in ice cold KCl solution (125 mM KCl, 20 mM 4-(2-hydroxyethyl)-1-piperazineethanesulfonic acid (HEPES), 2 mM K2HPO4, 5 mM glutamate, 5 mM malate, 1 mM MgCl2, pH 7.2) supplemented with 80 μM digitonin and 1 μM thapsigargin. The final solution contained <0.1% DMSO, originating from the digitonin and thapsigargin stocks. The cells were incubated on ice for 15 min and centrifuged (200 × g) for 10 min at 4 °C. The pelleted cells were then resuspended in high KCl solution containing 1 μM Calcium Green-5N (ThermoFisher, Waltham, MA) and 2 mM succinate to a final density of 5 × 10⁶ (HeLa) or 1 × 10⁷ (HEK293T) cells mL−1. For each experiment, 100 μL of the cell suspension was placed in each well of a black-walled 96-well plate, treated with the desired concentration of the test complex, and allowed to equilibrate at room temperature for ~200 s. The background fluorescence of each well was recorded for 60 s prior to addition of 10 (HeLa) or 20 (HEK293T) μM CaCl2. The change in fluorescence of the dye (ex. 488/em. 528) in response to Ca2+ was recorded every 5 s for at least 120 s or until the fluorescence returned to baseline. The mitochondrial Ca2+ uptake rate was calculated as the time constant in the exponential fit of the fluorescence response curve. Control cells that were not treated with compound were handled identically to the treated cells to account for different incubation lengths. The Ca2+ uptake rate of treated cells was normalized to that of the control cells (0% inhibition), and each replicate was performed using independently prepared cell suspensions to account for differences in cell count. The BCA assay was performed on each cell suspension for every experiment, giving a protein content of ~1200 μg mL−1 each time. The Hill Equation was used to determine the IC50 of MCU inhibition. Data are presented as the average of three independent biological replicates ± SD.
Mitochondrial Ca2+ Uptake in Intact HeLa Cells using Rhod 2-AM.
Approximately 1 × 10⁵ HeLa cells were seeded in 35 mm dishes and incubated overnight at 37 °C. The following day, cells were treated with the desired metal complex (50 μM) in DMEM supplemented with 10% FBS for 2 h at 37 °C. The culture media was removed, and the cells were washed with 1 × 1 mL PBS before the cells were incubated in extracellular medium (ECM; 135 mM NaCl, 20 mM HEPES, 5 mM KCl, 1 mM MgCl2, 1 mM CaCl2) supplemented with 10 mM glucose, 3.2 mg mL−1 bovine serum albumin (BSA), 0.003% Pluronic F127, and 2 μM Rhod 2-AM (Molecular Probes) in the dark for 30 min at room temperature. The ECM was then removed, the cells were washed with 1 × 1 mL ECM, and the cells were treated with ECM supplemented with 10 mM glucose and 3.2 mg mL−1 BSA and incubated for an additional 30 min in the dark at room temperature. The buffer was then removed, and the cells were washed with 1 × 1 mL ECM and treated with ECM supplemented with 10 mM glucose and 3.2 mg mL−1 BSA. The cells were incubated for 15 min at 37 °C before imaging using a Zeiss LSM i710 confocal microscope using a 40× oil objective with an excitation of 561 nm and an emission window of 568–712 nm. After ~30 s of baseline recording, histamine (100 μM) was added to the dish, and fluorescence images were collected every 3 s to monitor mCa2+ uptake. Images were analyzed and quantified using ImageJ and the CTCF was calculated. The average of at least five individual cells were used to determine the average CTCF for each replicate. Results are reported as the average of two independent replicates ± SD.
Supplementary Material
Acknowledgements
This research was supported by Cornell University, the United States National Science Foundation (NSF) under award number CHE-1750295, and the Research Corporation for Science and Advancement through a Cottrell Scholar Award. This work made use of the Cornell University NMR facility, which is supported by the NSF under award number CHE-1531632. In addition, the resources provided by the Cornell University Biotechnology Resource Center was utilized by this work, which is supported by the NIH (NIH S10RR025502).
Footnotes
Conflict of Interest
The authors declare no conflict of interest.
Data Availability Statement
The data that support the findings of this study are available in the supplementary material of this article.
References
- [1].Pozzan T; Rizzuto R; Volpe P; Meldolesi J. Physiol. Rev. 1994, 74, 595–636. [DOI] [PubMed] [Google Scholar]
- [2].Berridge MJ; Bootman MD; Roderick HL. Nat. Rev. Mol. Cell Biol. 2003, 4, 517–529. [DOI] [PubMed] [Google Scholar]
- [3].Clapham DE. Cell 2007, 131, 1047–1058. [DOI] [PubMed] [Google Scholar]
- [4].Kirichok Y; Krapivinsky G; Clapham DE. Nature 2004, 427, 360–364. [DOI] [PubMed] [Google Scholar]
- [5].Rizzuto R; De Stefani D; Raffaello A; Mammucari C. Nat. Rev. Mol. Cell Biol. 2012, 13, 566–578. [DOI] [PubMed] [Google Scholar]
- [6].Kamer KJ; Mootha VK. Nat. Rev. Mol. Cell Biol. 2015, 16, 545–553. [DOI] [PubMed] [Google Scholar]
- [7].Baughman JM; Perocchi F; Girgis HS; Plovanich M; Belcher-Timme CA; Sancak Y; Bao XR; Strittmatter L; Goldberger O; Bogorad RL; Koteliansky V; Mootha VK. Nature 2011, 476, 341–345. [DOI] [PMC free article] [PubMed] [Google Scholar]
- [8].De Stefani D; Raffaello A; Teardo E; Szabó I; Rizzuto R. Nature 2011, 476, 336–340. [DOI] [PMC free article] [PubMed] [Google Scholar]
- [9].Wang Y; Nguyen NX; She J; Zeng W; Yang Y; Bai X-C; Jiang Y. Cell 2019, 177, 1252–1261. [DOI] [PMC free article] [PubMed] [Google Scholar]
- [10].Kamer KJ; Sancak Y; Fomina Y; Meisel JD; Chaudhuri D; Grabarek Z; Mootha VK. Proc. Natl. Acad. Sci. U.S.A. 2018, 115, E7960–E7969. [DOI] [PMC free article] [PubMed] [Google Scholar]
- [11].Kamer KJ; Jiang W; Kaushik VK; Mootha VK; Grabarek Z. Proc. Natl. Acad. Sci. U.S.A. 2019, 116, 3546–3555. [DOI] [PMC free article] [PubMed] [Google Scholar]
- [12].Calì T; Ottolini D; Brini M. Cell Calcium 2012, 52, 73–85. [DOI] [PMC free article] [PubMed] [Google Scholar]
- [13].Sanderson TH; Reynolds CA; Kumar R; Przyklenk K; Huttemann M. Mol. Neuorobiol. 2013, 47, 9–23. [DOI] [PMC free article] [PubMed] [Google Scholar]
- [14].Abeti R; Abramov AY. Pharmacol. Res. 2015, 99, 377–381. [DOI] [PubMed] [Google Scholar]
- [15].Filadi R; Pizzo P. Curr. Opin. Physiol. 2020, 17, 224–233. [Google Scholar]
- [16].Gustafsson ÅB; Gottlieb RA. Cardiovasc. Res. 2008, 77, 334–343. [DOI] [PubMed] [Google Scholar]
- [17].Santulli G; Xie W; Reiken SR; Marks AR. Proc. Natl. Acad. Sci. U.S.A. 2015, 112, 11389–11394. [DOI] [PMC free article] [PubMed] [Google Scholar]
- [18].Zhou B; Tian R. J. Clin. Invest. 2018, 128, 3716–3726. [DOI] [PMC free article] [PubMed] [Google Scholar]
- [19].Vultur A; Gibhardt CS; Stanisz H; Bogeski I. Pflügers Arch. Eur. J. Physiol. 2018, 470, 1149–1163. [DOI] [PubMed] [Google Scholar]
- [20].Delierneux C; Kouba S; Shanmughapriya S; Potier-Cartereau M; Trebak M; Hempel N. Cells 2020, 9, 432. [DOI] [PMC free article] [PubMed] [Google Scholar]
- [21].Rimessi A; Pozzato C; Carparelli L; Rossi A; Ranucci S; de Fino I; Cigana C; Talarico A; Wieckowski MR; Ribeiro CMP; Trapella C; Rossi G; Cabrini G; Bragonzi A; Pinton P. Sci. Adv. 2020, 6, eaax9093. [DOI] [PMC free article] [PubMed] [Google Scholar]
- [22].Rimessi A; Vitto VAM; Patergnani S; Pinton P. Front. Pharmacol. 2021, 12, 581645. [DOI] [PMC free article] [PubMed] [Google Scholar]
- [23].Shintani-Ishida K; Inui M; Yoshida K. J. Mol. Cell. Cardiol. 2012, 53, 233–239. [DOI] [PubMed] [Google Scholar]
- [24].Woods JJ; Wilson JJ. Curr. Opin. Chem. Biol. 2020, 55, 9–18. [DOI] [PubMed] [Google Scholar]
- [25].Kon N; Murakoshi M; Isobe A; Kagechika K; Miyoshi N; Nagayama T. Cell Death Discovery 2017, 3, 17045. [DOI] [PMC free article] [PubMed] [Google Scholar]
- [26].Arduino DM; Wettmarshausen J; Vais H; Navas-Navarro P; Cheng Y; Leimpek A; Ma Z; Delrio-Lorenzo A; Giordano A; Garcia-Perez C; Médard G; Kuster B; García-Sancho J; Mokranjac D; Foskett JK; Alonso MT; Perocchi F. Mol. Cell 2017, 67, 711–723. [DOI] [PMC free article] [PubMed] [Google Scholar]
- [27].Schwartz J; Holmuhamedov E; Zhang X; Lovelace GL; Smith CD; Lemasters JJ. Toxicol. Appl. Pharmacol. 2013, 273, 172–179. [DOI] [PMC free article] [PubMed] [Google Scholar]
- [28].Di Marco G; Vallese F; Jourde B; Bergsdorf C; Sturlese M; De Mario A; Techer-Etienne V; Haasen D; Oberhauser B; Schleeger S; Minetti G; Moro S; Rizzuto R; De Stefani D; Fornaro M; Mammucari C. Cell Rep. 2020, 30, 2321–2331. [DOI] [PMC free article] [PubMed] [Google Scholar]
- [29].Thu VT; Kim H-K; Long LT; Lee S-R; Hanh TM; Ko TH; Heo H-J; Kim N; Kim SH; Ko KS; Rhee BD; Han J. Cardiovasc. Res. 2012, 94, 342–350. [DOI] [PubMed] [Google Scholar]
- [30].Santo-Domingo J; Vay L; Hernández-SanMiguel E; Lobatón CD; Moreno A; Montero M; Alvarez J. Br. J. Pharmacol. 2007, 151, 647–654. [DOI] [PMC free article] [PubMed] [Google Scholar]
- [31].Emerson J; Clarke MJ; Ying W-L; Sanadi DR. J. Am. Chem. Soc. 1993, 115, 11799–11805. [Google Scholar]
- [32].Matlib MA; Zhou Z; Knight S; Ahmed S; Choi KM; Krause-Bauer J; Phillips R; Altschuld R; Katsube Y; Sperelakis N; Bers DM. J. Biol. Chem. 1998, 273, 10223–10231. [DOI] [PubMed] [Google Scholar]
- [33].Unitt JF; Boden KL; Wallace AV; Ingall AH; Coombs ME; Ince F. Bioorg. Med. Chem. 1999, 7, 1891–1896. [DOI] [PubMed] [Google Scholar]
- [34].Nathan SR; Pino NW; Arduino DM; Perocchi F; MacMillan SN; Wilson JJ. Inorg. Chem. 2017, 56, 3123–3126. [DOI] [PubMed] [Google Scholar]
- [35].Woods JJ; Nemani N; Shanmughapriya S; Kumar A; Zhang M; Nathan SR; Thomas M; Carvalho E; Ramachandran K; Srikantan S; Stathopulos PB; Wilson JJ; Madesh M. ACS Cent. Sci. 2019, 5, 153–166. [DOI] [PMC free article] [PubMed] [Google Scholar]
- [36].Woods JJ; Rodriguez MX; Tsai C-W; Tsai M-F; Wilson JJ. Chem. Commun. 2021, 57, 6161–6164. [DOI] [PMC free article] [PubMed] [Google Scholar]
- [37].Bigham NP; Huang Z; Spivey JA; Woods JJ; MacMillan SN; Wilson JJ. Inorg. Chem. 2022, 61, 17299–17312. [DOI] [PMC free article] [PubMed] [Google Scholar]
- [38].Cervinka J; Gobbo A; Biancalana L; Markova L; Novohradsky V; Guelfi M; Zacchini S; Kasparkova J; Brabec V; Marchetti F. J. Med. Chem. 2022, 65, 10567–10587. [DOI] [PMC free article] [PubMed] [Google Scholar]
- [39].Woods JJ; Novorolsky RJ; Bigham NP; Robertson GS; Wilson JJ. RSC Chem. Biol. 2023. 10.1039/d2cb00189f [DOI] [PMC free article] [PubMed] [Google Scholar]
- [40].Tashmukhamedov BA; Gagelgans AI; Mamatkulov K; Makhmudova EM. FEBS Lett. 1972, 28, 239–242. [DOI] [PubMed] [Google Scholar]
- [41].Geue RJ; Sargeson AM; Hambley TW; Snow MR; Harrowfield JM. J. Am. Chem. Soc. 1984, 106, 5478–5488. [Google Scholar]
- [42].Sargeson AM. Coord. Chem. Rev. 1996, 151, 89–114. [Google Scholar]
- [43].Geue RJ; Searle GH. Aust. J. Chem. 1983, 36, 927–935. [Google Scholar]
- [44].Geue R; Petri W; Sargeson A; Snow M. Aust. J. Chem. 1992, 45, 1681–1703. [Google Scholar]
- [45].Phillips C. Bio-protocol 2018, 8, e2934. [DOI] [PMC free article] [PubMed] [Google Scholar]
Associated Data
This section collects any data citations, data availability statements, or supplementary materials included in this article.
Supplementary Materials
Data Availability Statement
The data that support the findings of this study are available in the supplementary material of this article.