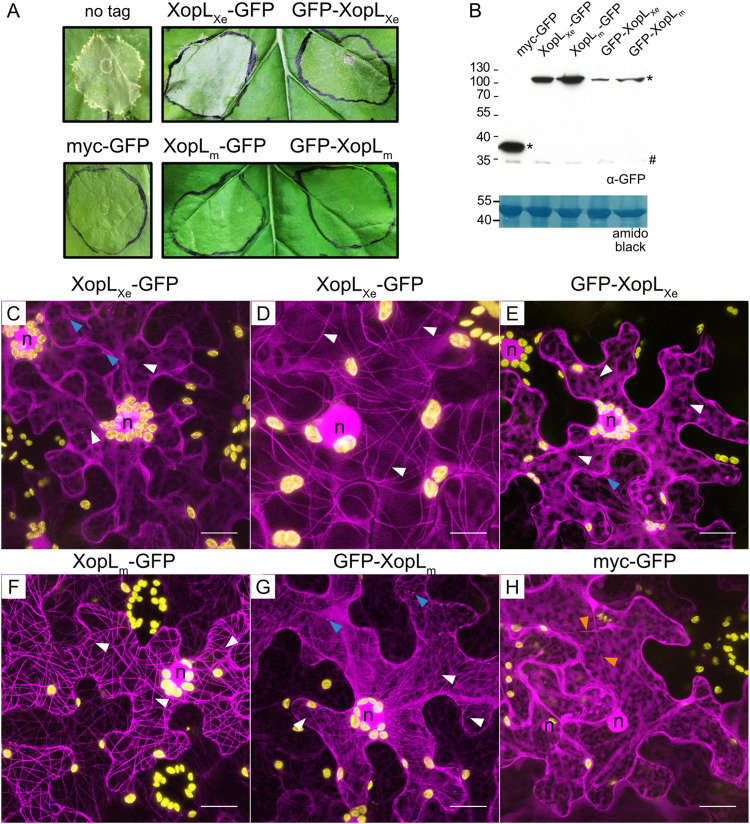
Fig 2. XopLXe-induced cell death and MT-localization are negatively affected by an N-terminal fluorescence tag.
(A) Analysis of cell death induction following agroinfection of N. benthamiana leaves to express untagged XopLXe and XopLm (E3 ligase-inactive, H584A, L585A, G586E) N- or C-terminally fused to GFP and GFP alone (OD600 of 0.4). Plant reactions were monitored 5 dpi. (B) Western blot analysis of protein extracts isolated 2 dpi from the experiment depicted in (A). Protein signals were detected with a GFP-specific antibody (*). The left side of the blot shows protein mass in kDa; # indicates a non-specific signal. Amido black staining is included as a loading control. (C-G) Confocal microscopy pictures of lower epidermal cells 2 dpi from the experiment depicted in (A). Images depict the subcellular phenotypes of (C) XopLXe-GFP, (D) a lower expressing cell from the same inoculation spot as in (C) (imaging with the LSM 780 required a laser intensity of 16.8% laser power vs. 10% used in (C), with identical gain settings), (E) GFP-XopLXe, (F) XopLm-GFP, (G) GFP-XopLm and (H) myc-GFP. GFP-labeled protein fusions are visible in magenta, plastid autofluorescence in yellow. Nuclei are labeled with ‘n’, blue arrows label mobile dots, white arrows point out microtubules and orange arrows label cytosolic strands. Scale bars are 20 μm for all images except (D), where the scale is 10 μm.

