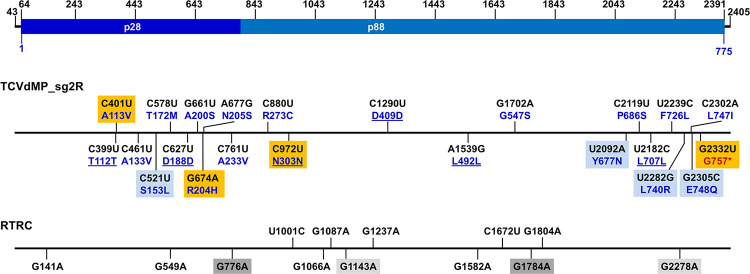
Fig 2. Mapping the identified errors to TCV genome.
The top diagram depicts the 2,363-bp range, corresponding to TCV genome positions 43 to 2,435, used for error identification. The numbers on top were added as references for convenient allocation of the errors. Within this range, positions 64–2391 encompasses the 775-aa p88 ORF. The middle diagram depicts the 23 errors identified in TCVdMP_sg2R-derived clones, and their corresponding aa changes. The nt changes, converted to (+) polarity, are shown in black font, whereas the corresponding aa changes are shown in dark blue. The unaltered aa residues are underlined. Errors identified from the same clone are highlighted with same-colored boxes (light blue or orange). The bottom diagram depicts 13 errors identified in RTRC-derived clones. Errors occurring in the same clone are highlighted with either light or dark gray boxes.

