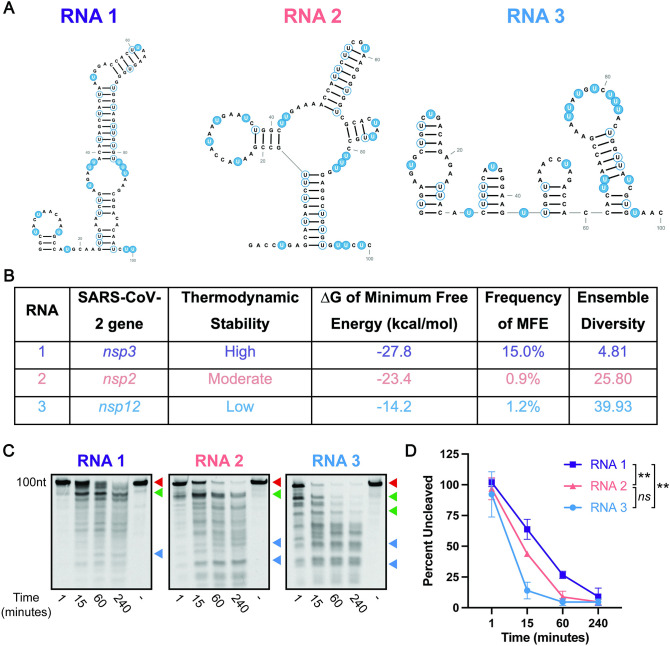
Fig 1. Secondary structure protects RNA from cleavage by SARS-CoV-2 nsp15.
A. Predicted minimum free energy structures (RNAfold) of 100 nt RNAs from the SARS-CoV-2 genome of varying thermodynamic stability (high, medium, and low). Unpaired uridines are highlighted in blue, and paired uridines are outlined in blue. All RNA structures were predicted in RNAfold and designed in RNA2Drawer [34, 36]. B. The locations within the SARS-CoV-2 genome are indicated for each structure, and thermodynamic stability is indicated as -ΔG. Frequency of MFE and ensemble diversity is listed as predicted by RNAfold. C. Endonuclease assays of RNAs from (A) at a nsp15 hexamer:RNA ratio of 1:600. Full-length (uncut) RNAs are indicated by the red arrows. Diminishing cleavage products (cleavage intermediates) are indicated by green arrows. Accumulating cleavage products (cleavage end products) indicated by blue arrows. RNAs were run on a 15% TBE-Urea Gel. Representative images from one of three total experiments are shown. D. Quantitation of data from (C). The percentage of full-length RNA remaining was measured by densitometry. Most thermodynamically stable RNA (RNA 1) was cleaved least rapidly relative to other RNAs. Percentage of uncut RNA was calculated by normalizing to a denatured nsp15 control (indicated by (-) in the far-right lane). Area under the curve (AUC) was calculated for each RNA, and one-way ANOVA with multiple comparisons was performed on the AUC. Data represents three independent experiments.

