Figure 2.
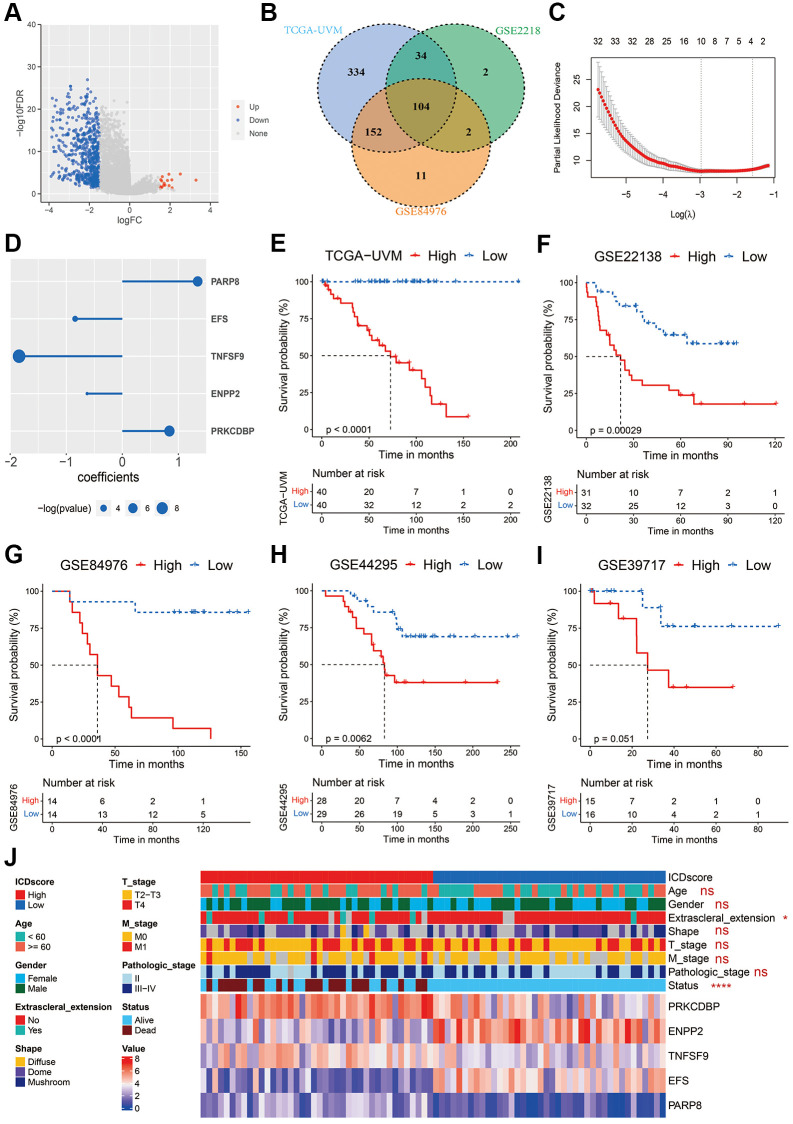
Construction of the ICDscore. (A) The volcano plot of DEGs between the C1 and C2 clusters of UVM patients from the TCGA-UVM cohort. (B) Venn diagram of DEGs with significant prognostic p-value < 0.1 in the TCGA-UVM, GSE2218 and GSE84976 cohorts. (C) The LASSO Cox regression model was constructed from 104 common DEGs, and 10 core genes selected according to the best fit profile. (D) Multi-variate Cox analysis revealed that five genes were independent prognostic factors for UVM patients from the TCGA-UVM cohort. (E–I) Kaplan-Meier curves of OS in UVM patients from high-ICDscore and low-ICDscore subclusters of TCGA-UVM (E), GSE22138 (F), GSE84976 (G), GSE44295 (G) and GSE39717 (I) cohorts. (J) Clinical features and RNA expression level of five core genes in patients from high-ICDscore and low-ICDscore subclusters of the TCGA-UVM cohort. Abbreviation: Ns: not significant. *p < 0.05; **p < 0.01; ***p < 0.001; ****p < 0.0001.

