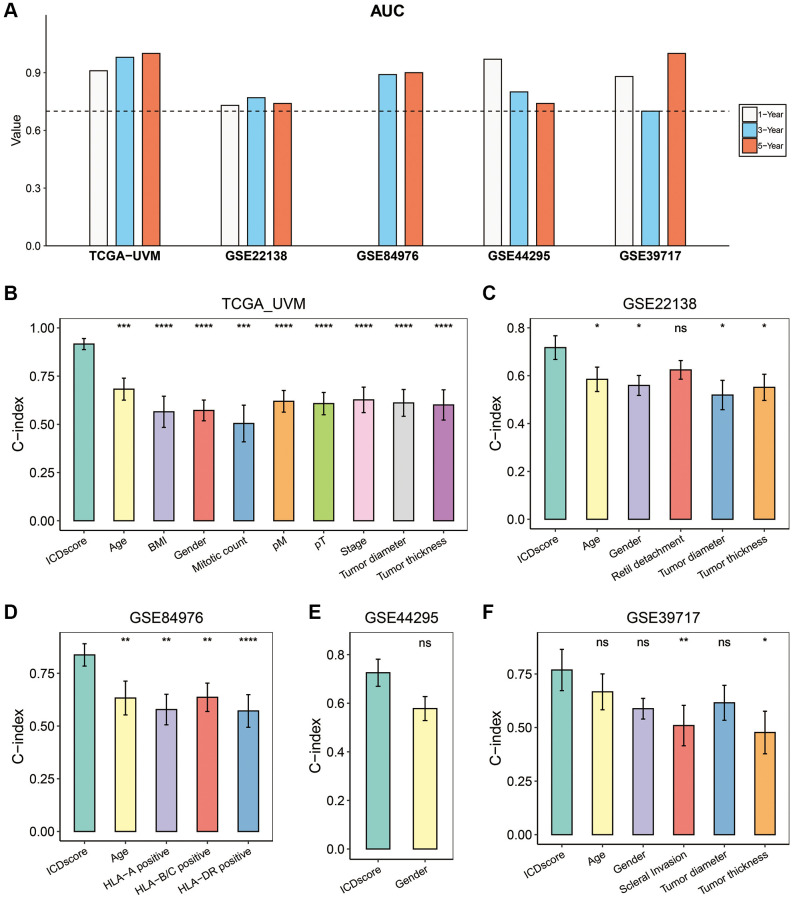
Figure 4.
Evaluation of the ICDscore in UVM. (A) The 1-, 3-, and 5-year AUCs of the ICDscore in the TCGA-UVM, GSE22138, GSE84976, GSE44295, and GSE39717 cohorts. (B–F) The C-index (95% confidence interval) of the ICDscore and clinical features in the TCGA-UVM (B), GSE22138 (C), GSE84976 (D), GSE44295 (E), and GSE39717 (F) cohorts. Abbreviation: Ns: not significant. *p < 0.05; **p < 0.01; ***p < 0.001; ****p < 0.0001.

