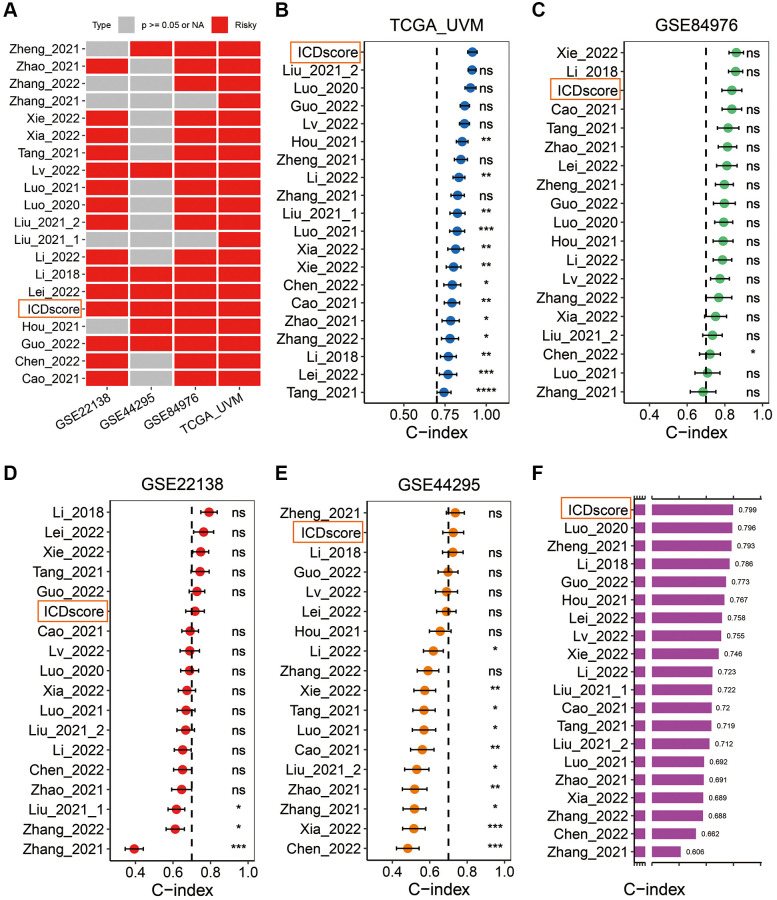
Figure 5.
Comparison between the ICDscore and other published signatures. (A) Univariate Cox regression analysis of the ICDscore and 19 published mRNA signatures in TCGA-UVM, GSE22138, GSE44295 and GSE84976 cohorts. (B–E) C-index analyses of the ICDscore and 19 published mRNA signatures in TCGA-UVM (B), GSE84976 (C), GSE22138 (D), and GSE44295 (E) cohorts. Statistic tests: two-sided z-score test. Data are presented as mean ± 95% confidence interval (CI). (F) The average C-index of the ICDscore and 19 published mRNA signatures across all studied cohorts. Abbreviation: Ns: not significant. *p < 0.05; **p < 0.01; ***p < 0.001; ****p < 0.0001.

