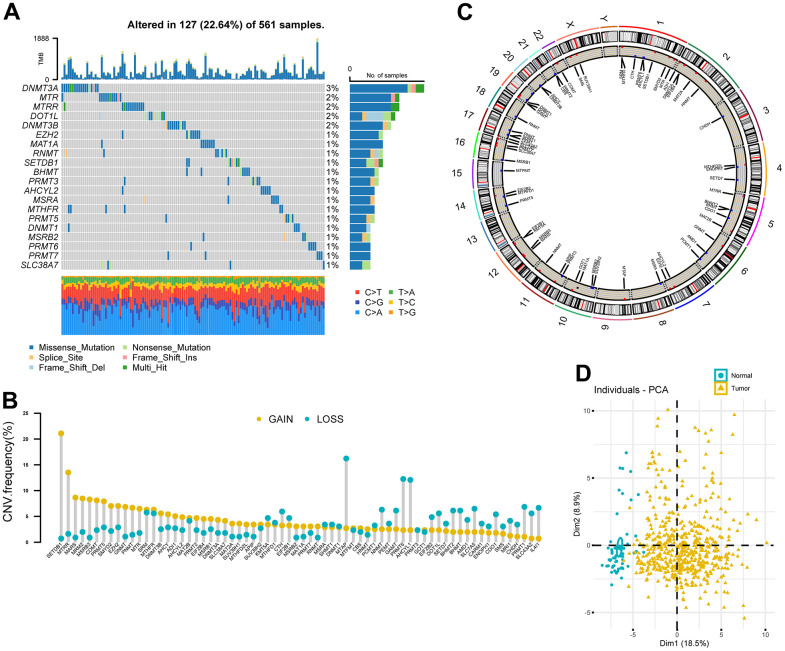
Figure 2.
Landscape of genetic variation of methionine regulators in LUAD. (A) Oncoprint plot showing mutation frequencies of MRGs in 561 patients with LUAD. (B) The CNV alteration frequency of 68 MRGs. The column represented the alteration frequency. The deletion frequency, blue dot; The amplification frequency, yellow dot. (C) Circos plot showing the location of CNV alteration of MRGs on chromosomes. (D) Principal component analysis of 68 MRGs to distinguish tumors from normal samples in the TCGA LUAD cohort.

