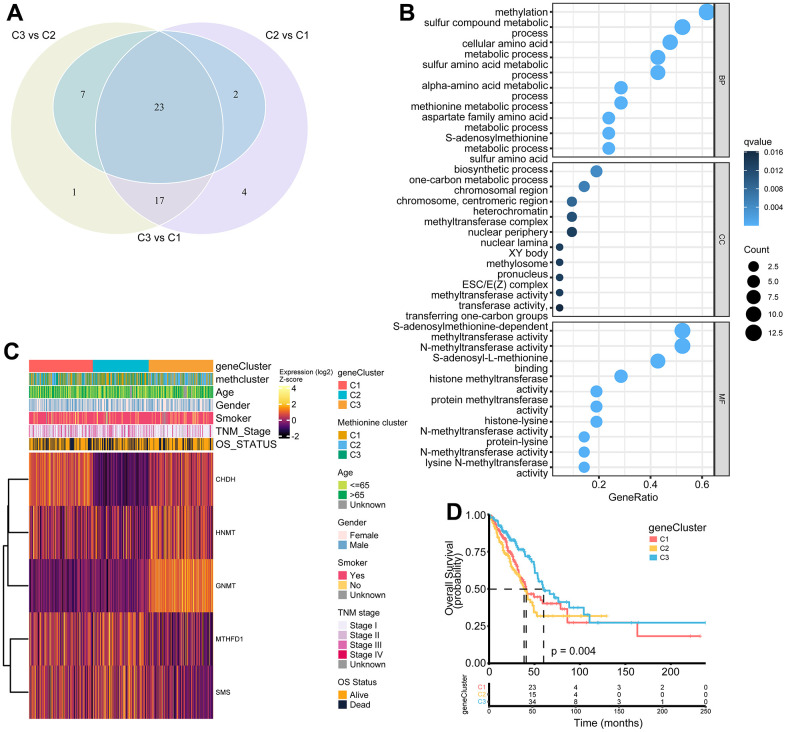
Figure 5.
Construction of MRG gene signatures and functional annotation. (A) Venn diagram showing 23 MRG-related differentially expressed genes (DEGs) among three MRG-clusters. Vs means that the gene expression profiles from one cluster was compared to another cluster. (B) Functional annotation for MRG-related genes using GO enrichment analysis. The color depth of the bubbles represents the q value and the size of the bubbles represents the count of genes enriched. (C) Heatmap showing association between the expression of core DEGs and clinical characteristics in the TCGA LUAD cohort. The gene clusters, MethClusters, age, gender, smoking status, TNM stage, and survival status were used as patient annotations. (D) Survival analysis for the three gene clusters based on 517 patients from the TCGA LUAD cohort.

