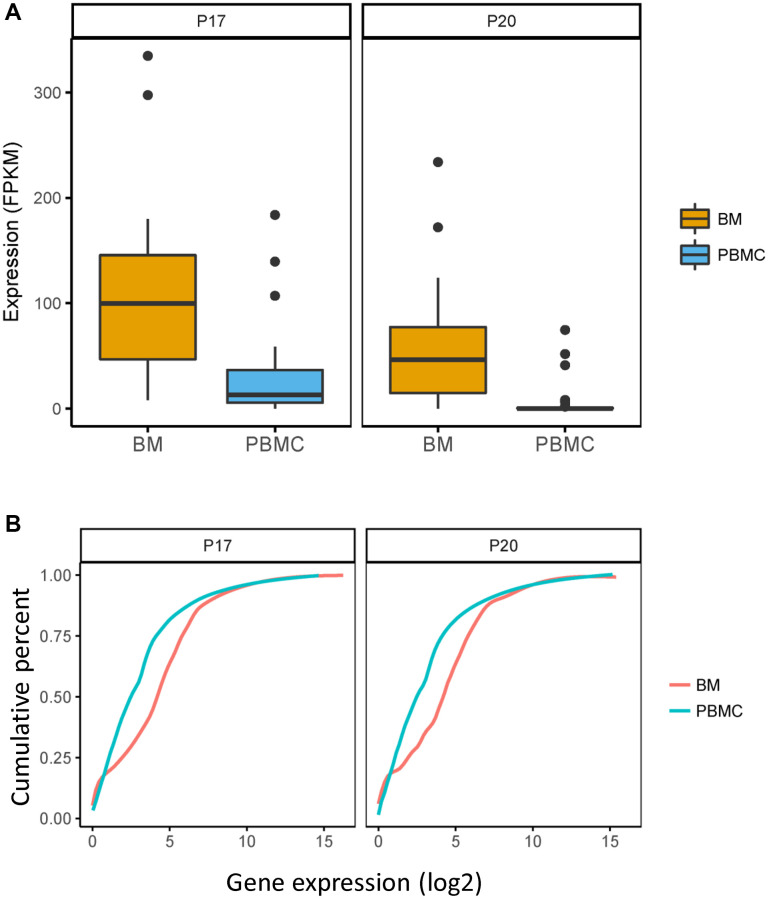
Figure 2.
FAM46C expressed differently in CPCs versus BMMCs in P17 and P20 patient. Comparation of expression level of FAM46C and the whole transcriptome in CPCs and BMMCs of P17 and P20 patient. (A) FAM46C decreases in CPCs compared with BMMCs in P17 and P20 patients. P17: P = 9.4E-05, FC = −1.85; P20: P = 9.4E-05, FC = −3.53; Unpaired t test, two sided. (B) Lower transcriptome expression level in CPCs compared with BMMCs of single cell transcriptome in P17 and P20 patients. P17: P = 0.0003; P20: P < 0.0001; Kolmogorov-Smirnov test.

