Figure 4.
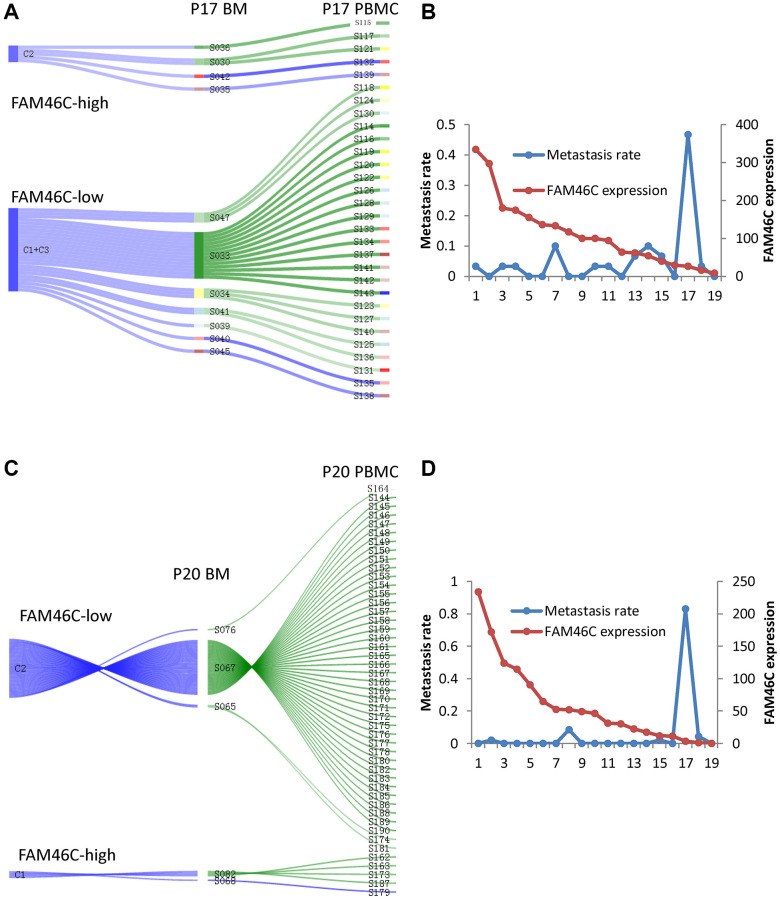
The model of extramedullary metastasis in EMP+ patient P17 and P20 at single cell transcriptome level. (A) Sankey diagram shows the model of extramedullary metastasis in EMP+ patient P17 at single cell transcriptome level. 3 clones were shown the right is all the CPCs in EMP+ patient P17. The middle is the related BMMCs in EMP+ patient P17. The left is the cluster of the BMMCs in EMP+ patient P17. The line between CPCs and BMMCs means that BMMC with the best Pearson correlation was chosen for a certain CPC. (B) The relationship between FAM46C expression level and metastasis rate in EMP+ patient P17. (C) Sankey diagram shows the model of extramedullary metastasis in EMP+ patient P20 at single cell transcriptome level. 2 clones were shown. The right is all the CPCs in EMP+ patient P20. The middle is the related BMMCs in EMP+ patient P20. The left is the cluster of the BMMCs in EMP+ patient P20. The line between CPCs and BMMCs means that BMMC with the best Pearson correlation was chosen for a certain CPC. (D) The relationship between FAM46C expression level and metastasis rate in EMP+ patient P20.

