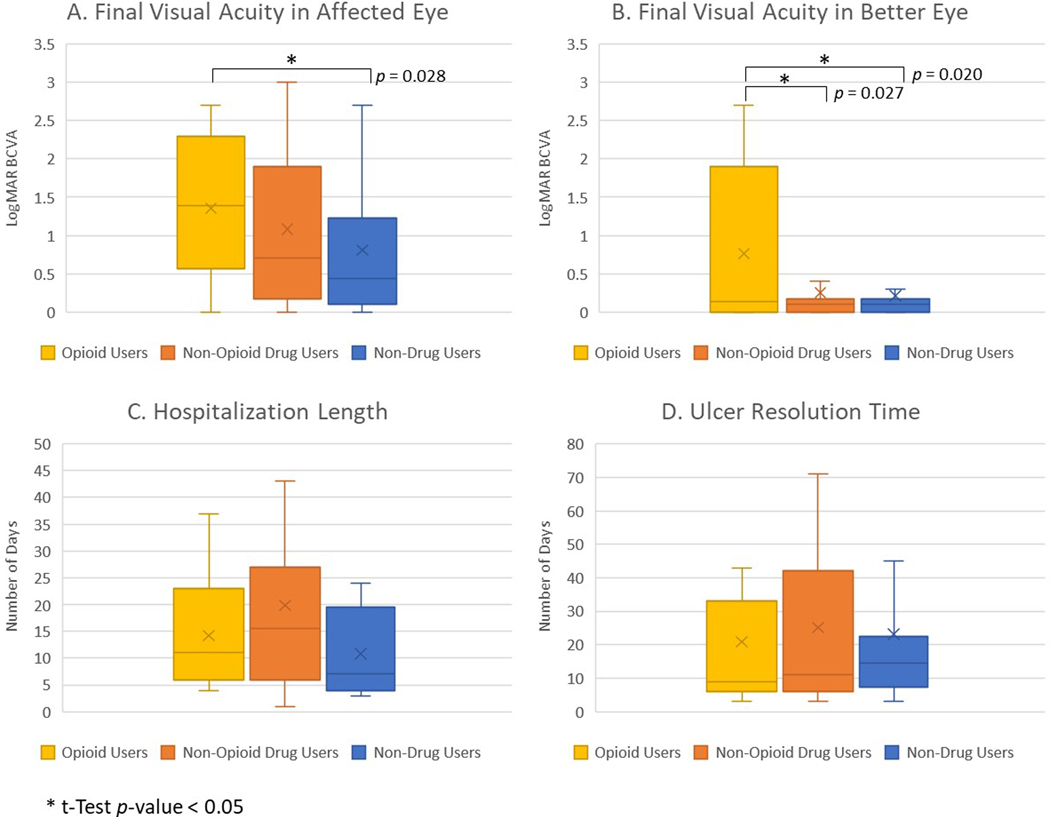
Figure 3:
Treatment outcomes for infectious keratitis stratified by drug use status. Box and whisker plots of final best corrected visual acuity (BCVA) in affected eye (A) and better eye (B), hospitalization length (C), and ulcer resolution time (D), showing median value line and upper and lower quartiles, with errors bars as minimum and maximum values and x as mean marker. BCVA was measured in logMAR estimate of , with higher logMAR indicating worse BCVA. *t-Test p-value < 0.05.

