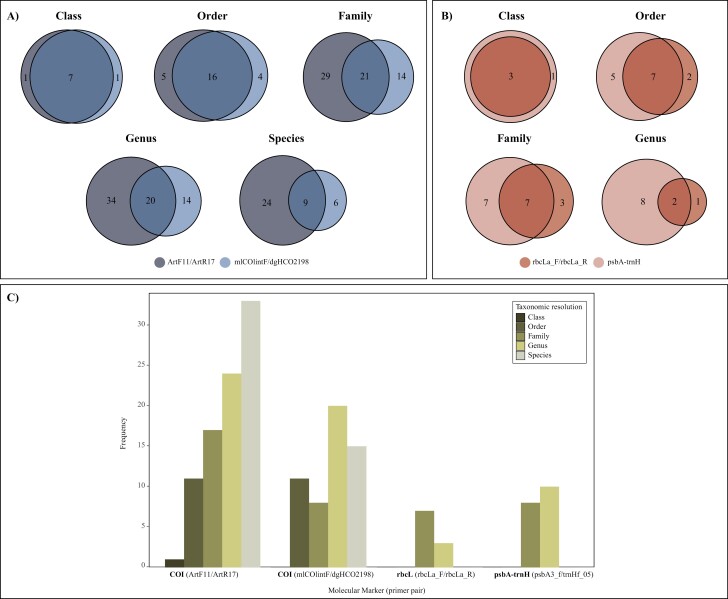
Figure 2.
Venn diagrams showing the overlap in terms of taxonomic identification of prey animals (A) and diet plants (B) at different taxonomic ranks. (C) Distribution of finest OTU taxonomic identifications (i.e., taxonomic resolution) reported by each of the four molecular markers used in the study.

