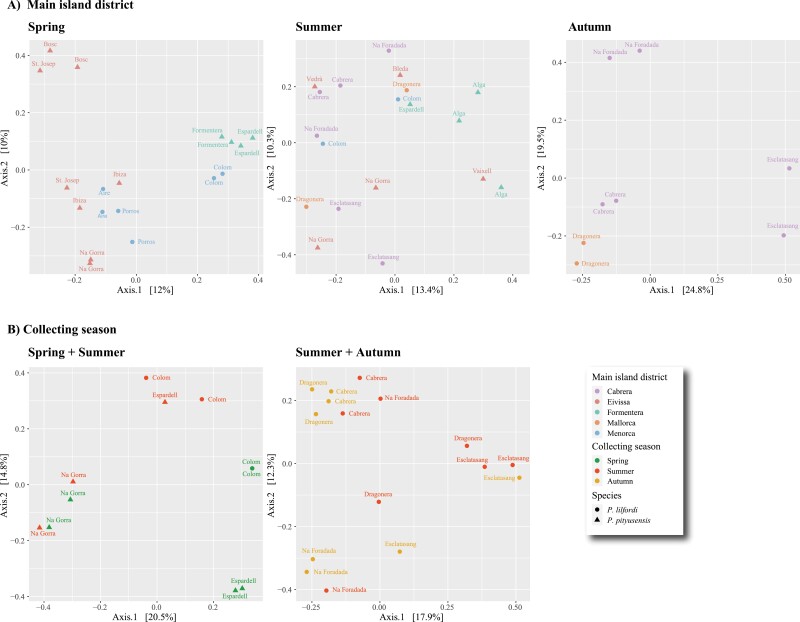
Figure 4.
Principal coordinate analyses based on the Jaccard distance matrices from the five analyzed datasets (see main text for details); (A) highlighting the main island district effect (dot colors) and lizard species (dot shapes); (B) highlighting the effect of season (dot colors) and lizard species (dot shapes) (See online version for color figure).

