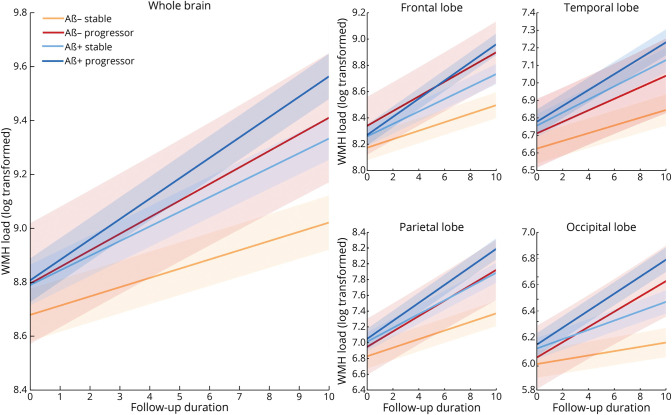
Figure 2. Longitudinal Change in Total and Regional WMH Volume by Group.
Longitudinal WMH distributions (log transformed) across diagnostic groups for each lobe. The first and second rows show the log-transformed WMH loads for each group by lobe. Aβ+ progressor, Aβ− progressor, Aβ+ stable, and Aβ− stable. Aβ− = amyloid negative; Aβ+ = amyloid positive; WMH = white matter hyperintensity.

