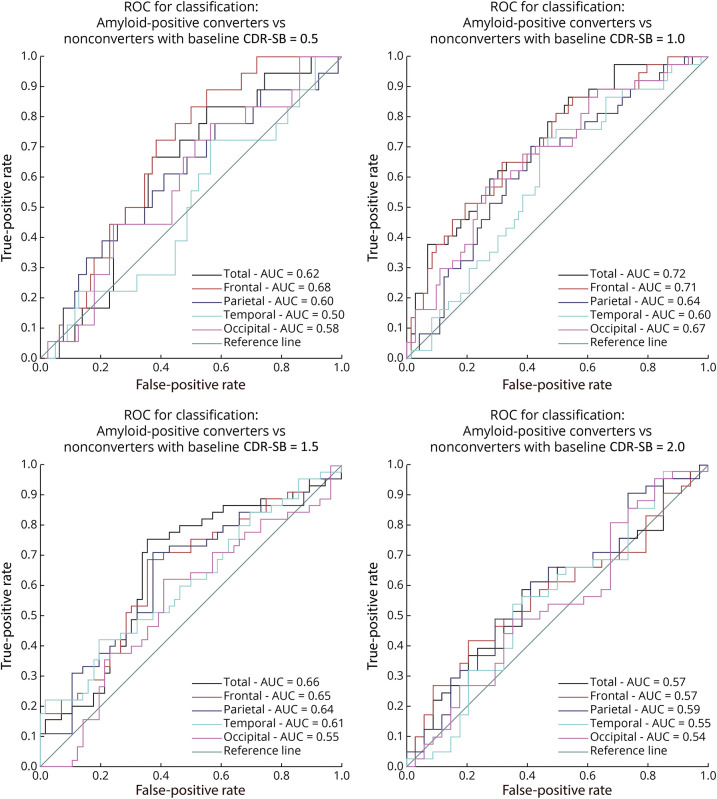
Figure 3. ROC Analysis to Compare the AUC of Amyloid Positive Converters With Nonconverters.
ROC analysis to compare the AUC of amyloid-positive converters with nonconverters at 0.5, 1.0, 1.5, and 2.0 CDR-SB scores for regional and total WMH. AUC = area under the curve; CDR-SB = Clinical Dementia Rating–Sum of Boxes; ROC = receiver operating characteristic; WMH = white matter hyperintensity.

