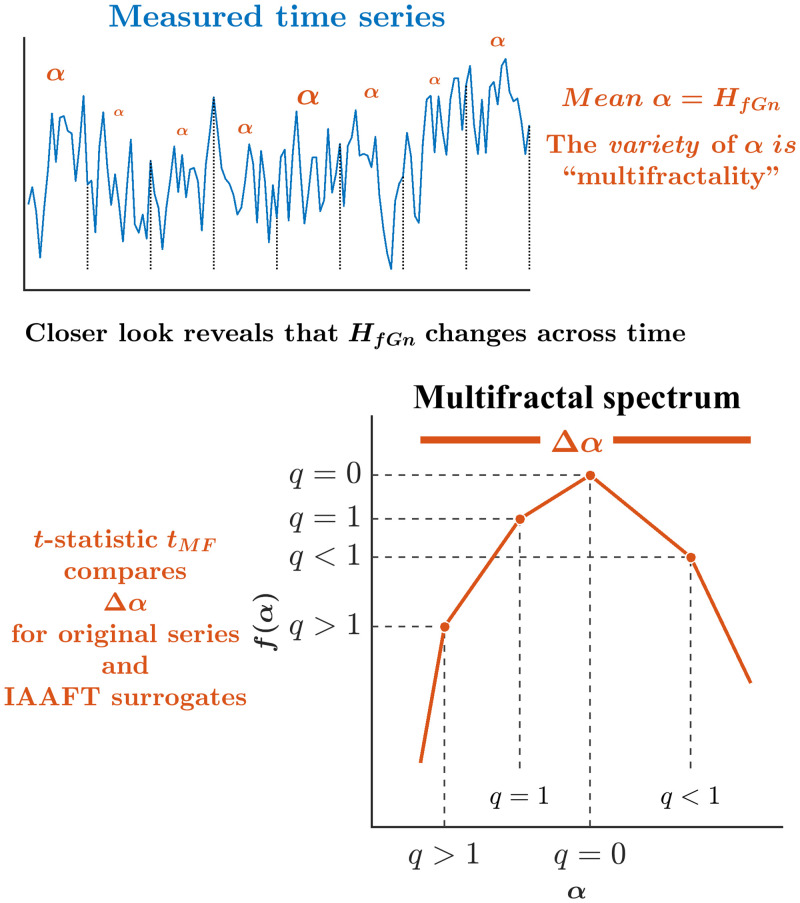
Fig 7. Schematic portrayal of Δα and tMF.
While HfGn is the best single, average description of temporal structure for the whole time series, the fractal structure might change across time as indicated by local scaling exponents α. Δα indicates the width of a spectrum of fractal exponents across time f(α) indicating how much of the time series exhibits each value of α. The one-sample t-statistic tMF takes the subtractive difference between Δα for original time series and an average Δα for 32 surrogates, dividing by the standard error of Δα for the surrogates. tMF > 1.98 is interpreted as evidence of nonlinear interactions across timescales resembling an intermittent cascade.

