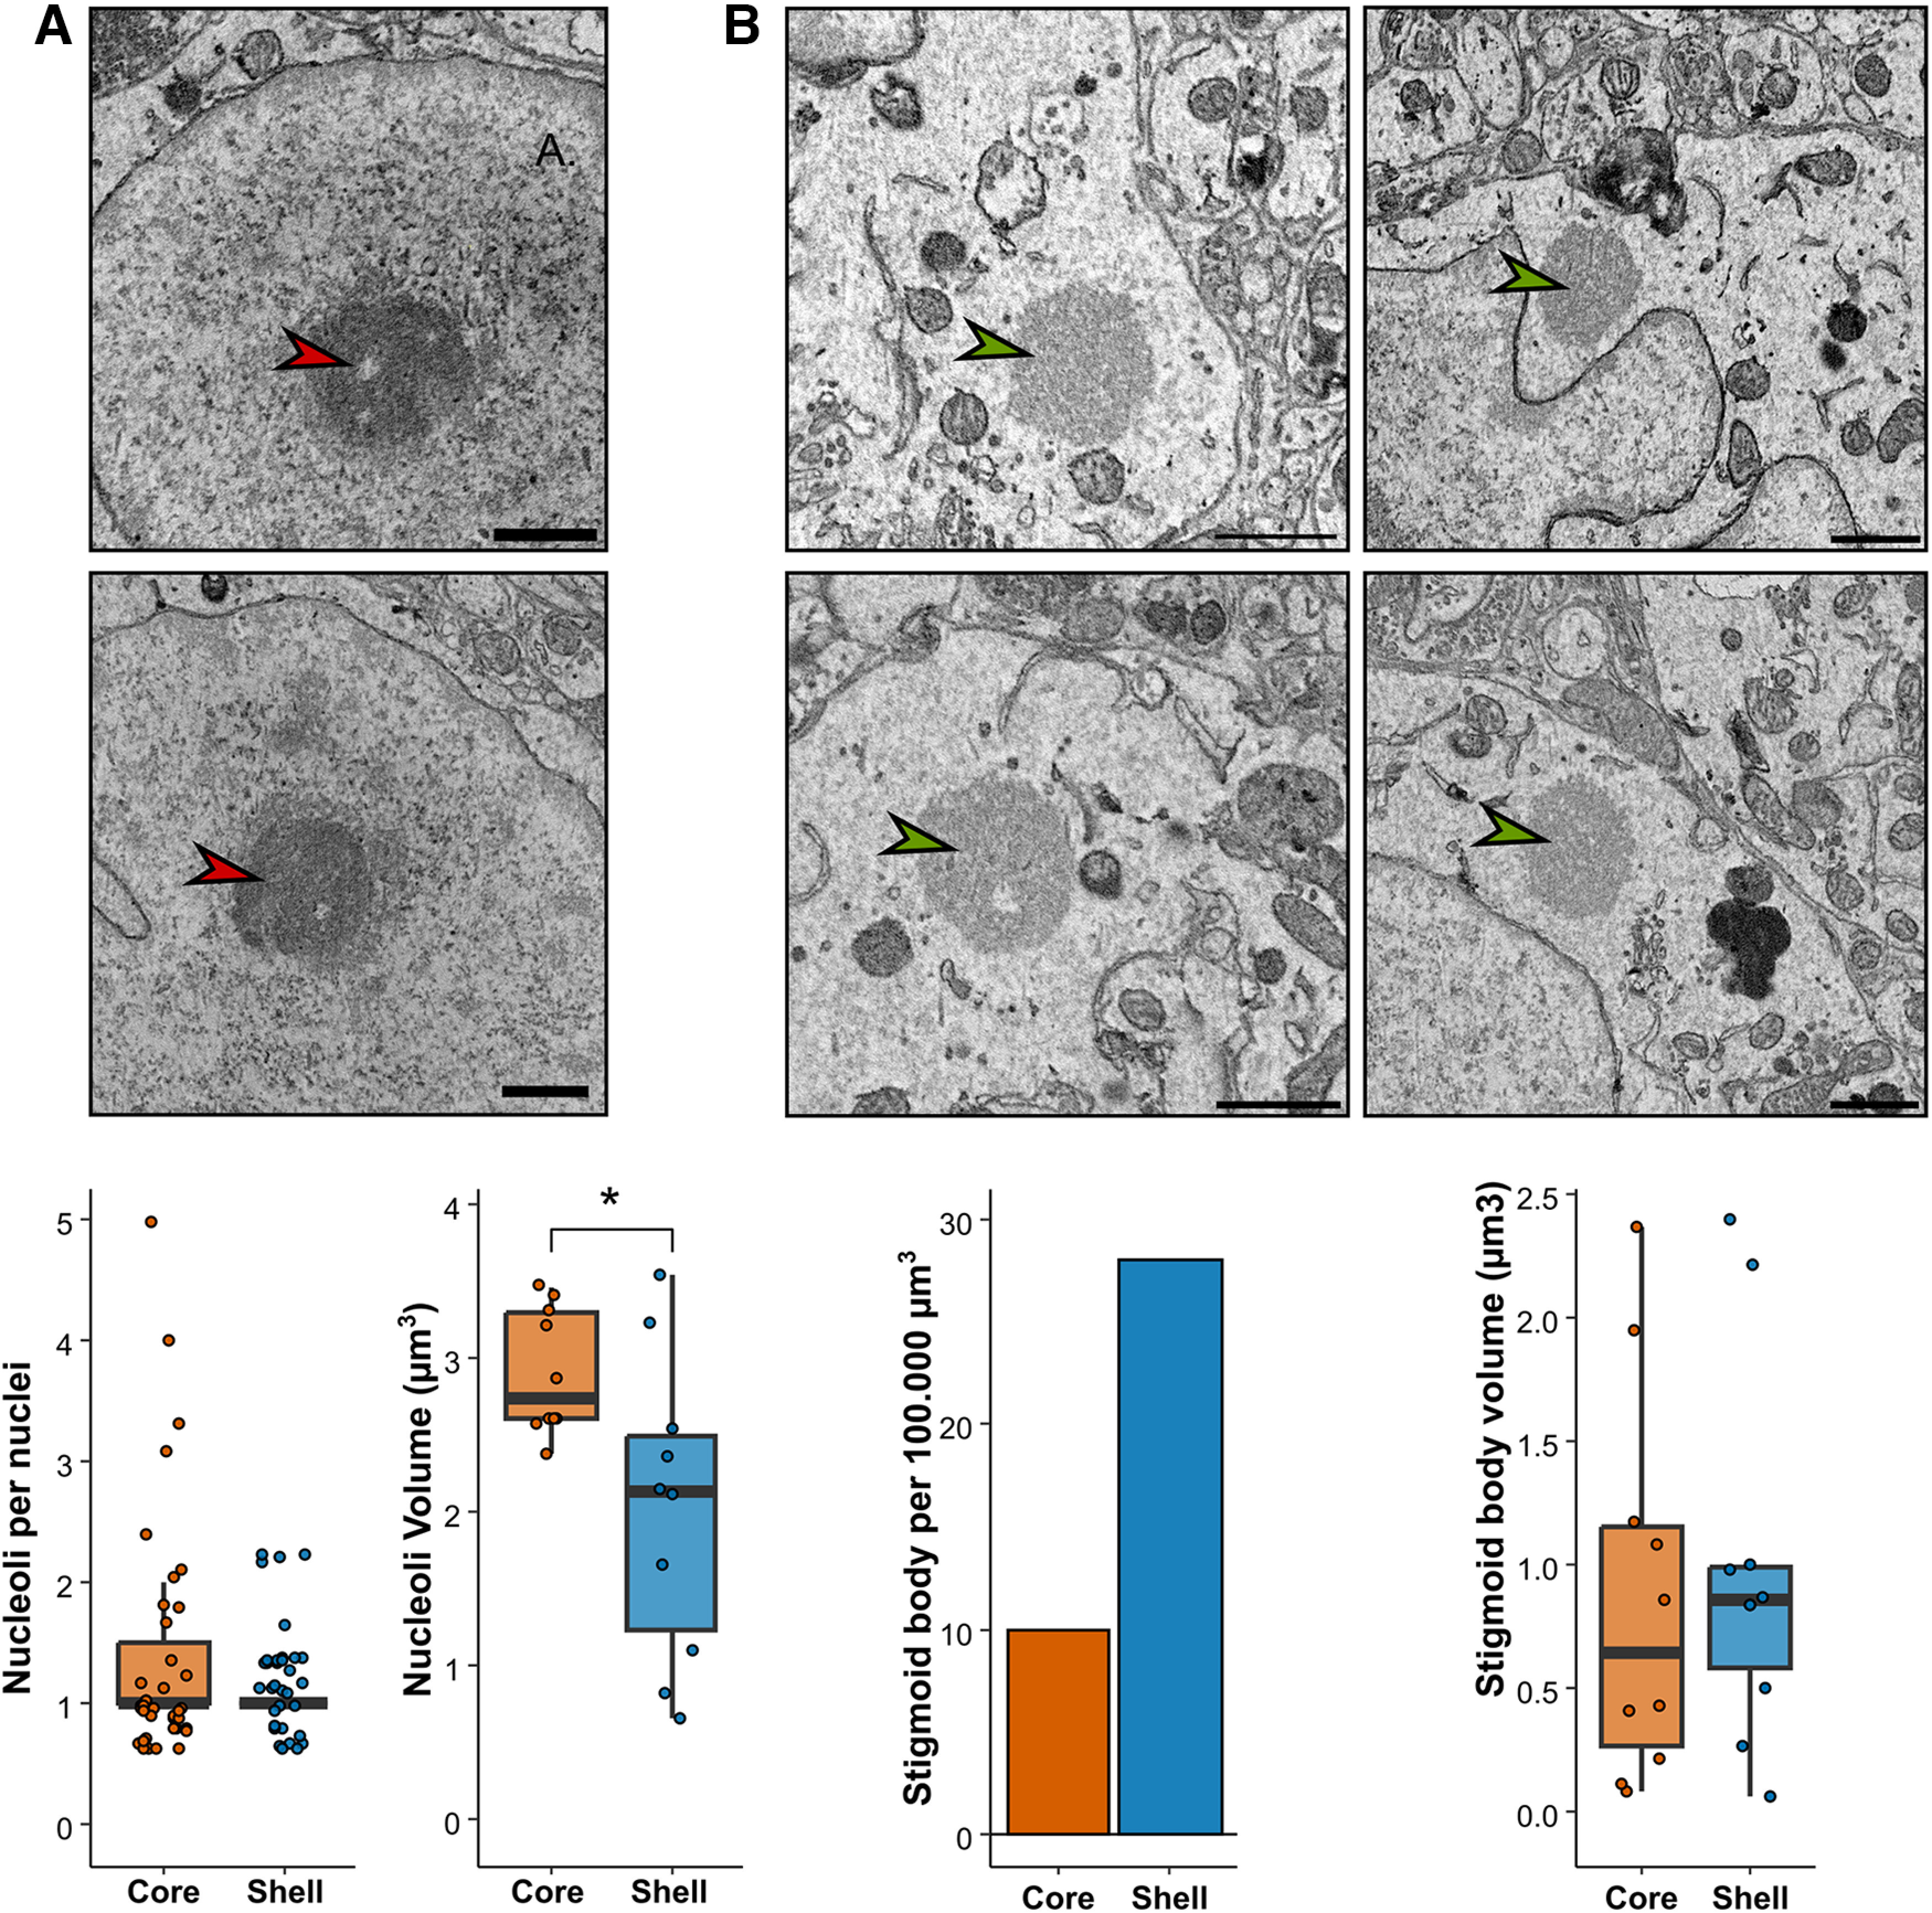
Figure 3.

Nucleoli and stigmoid bodies in the core and the shell regions of the SCN. A, Representative EM image (red arrows upper panel), linear density and volume of nucleoli per nuclei (lower panel) in the core and the shell. B, Representative EM image (green arrows, upper panel), density and volume of stigmoid bodies (lower panel) in the core and the shell.
