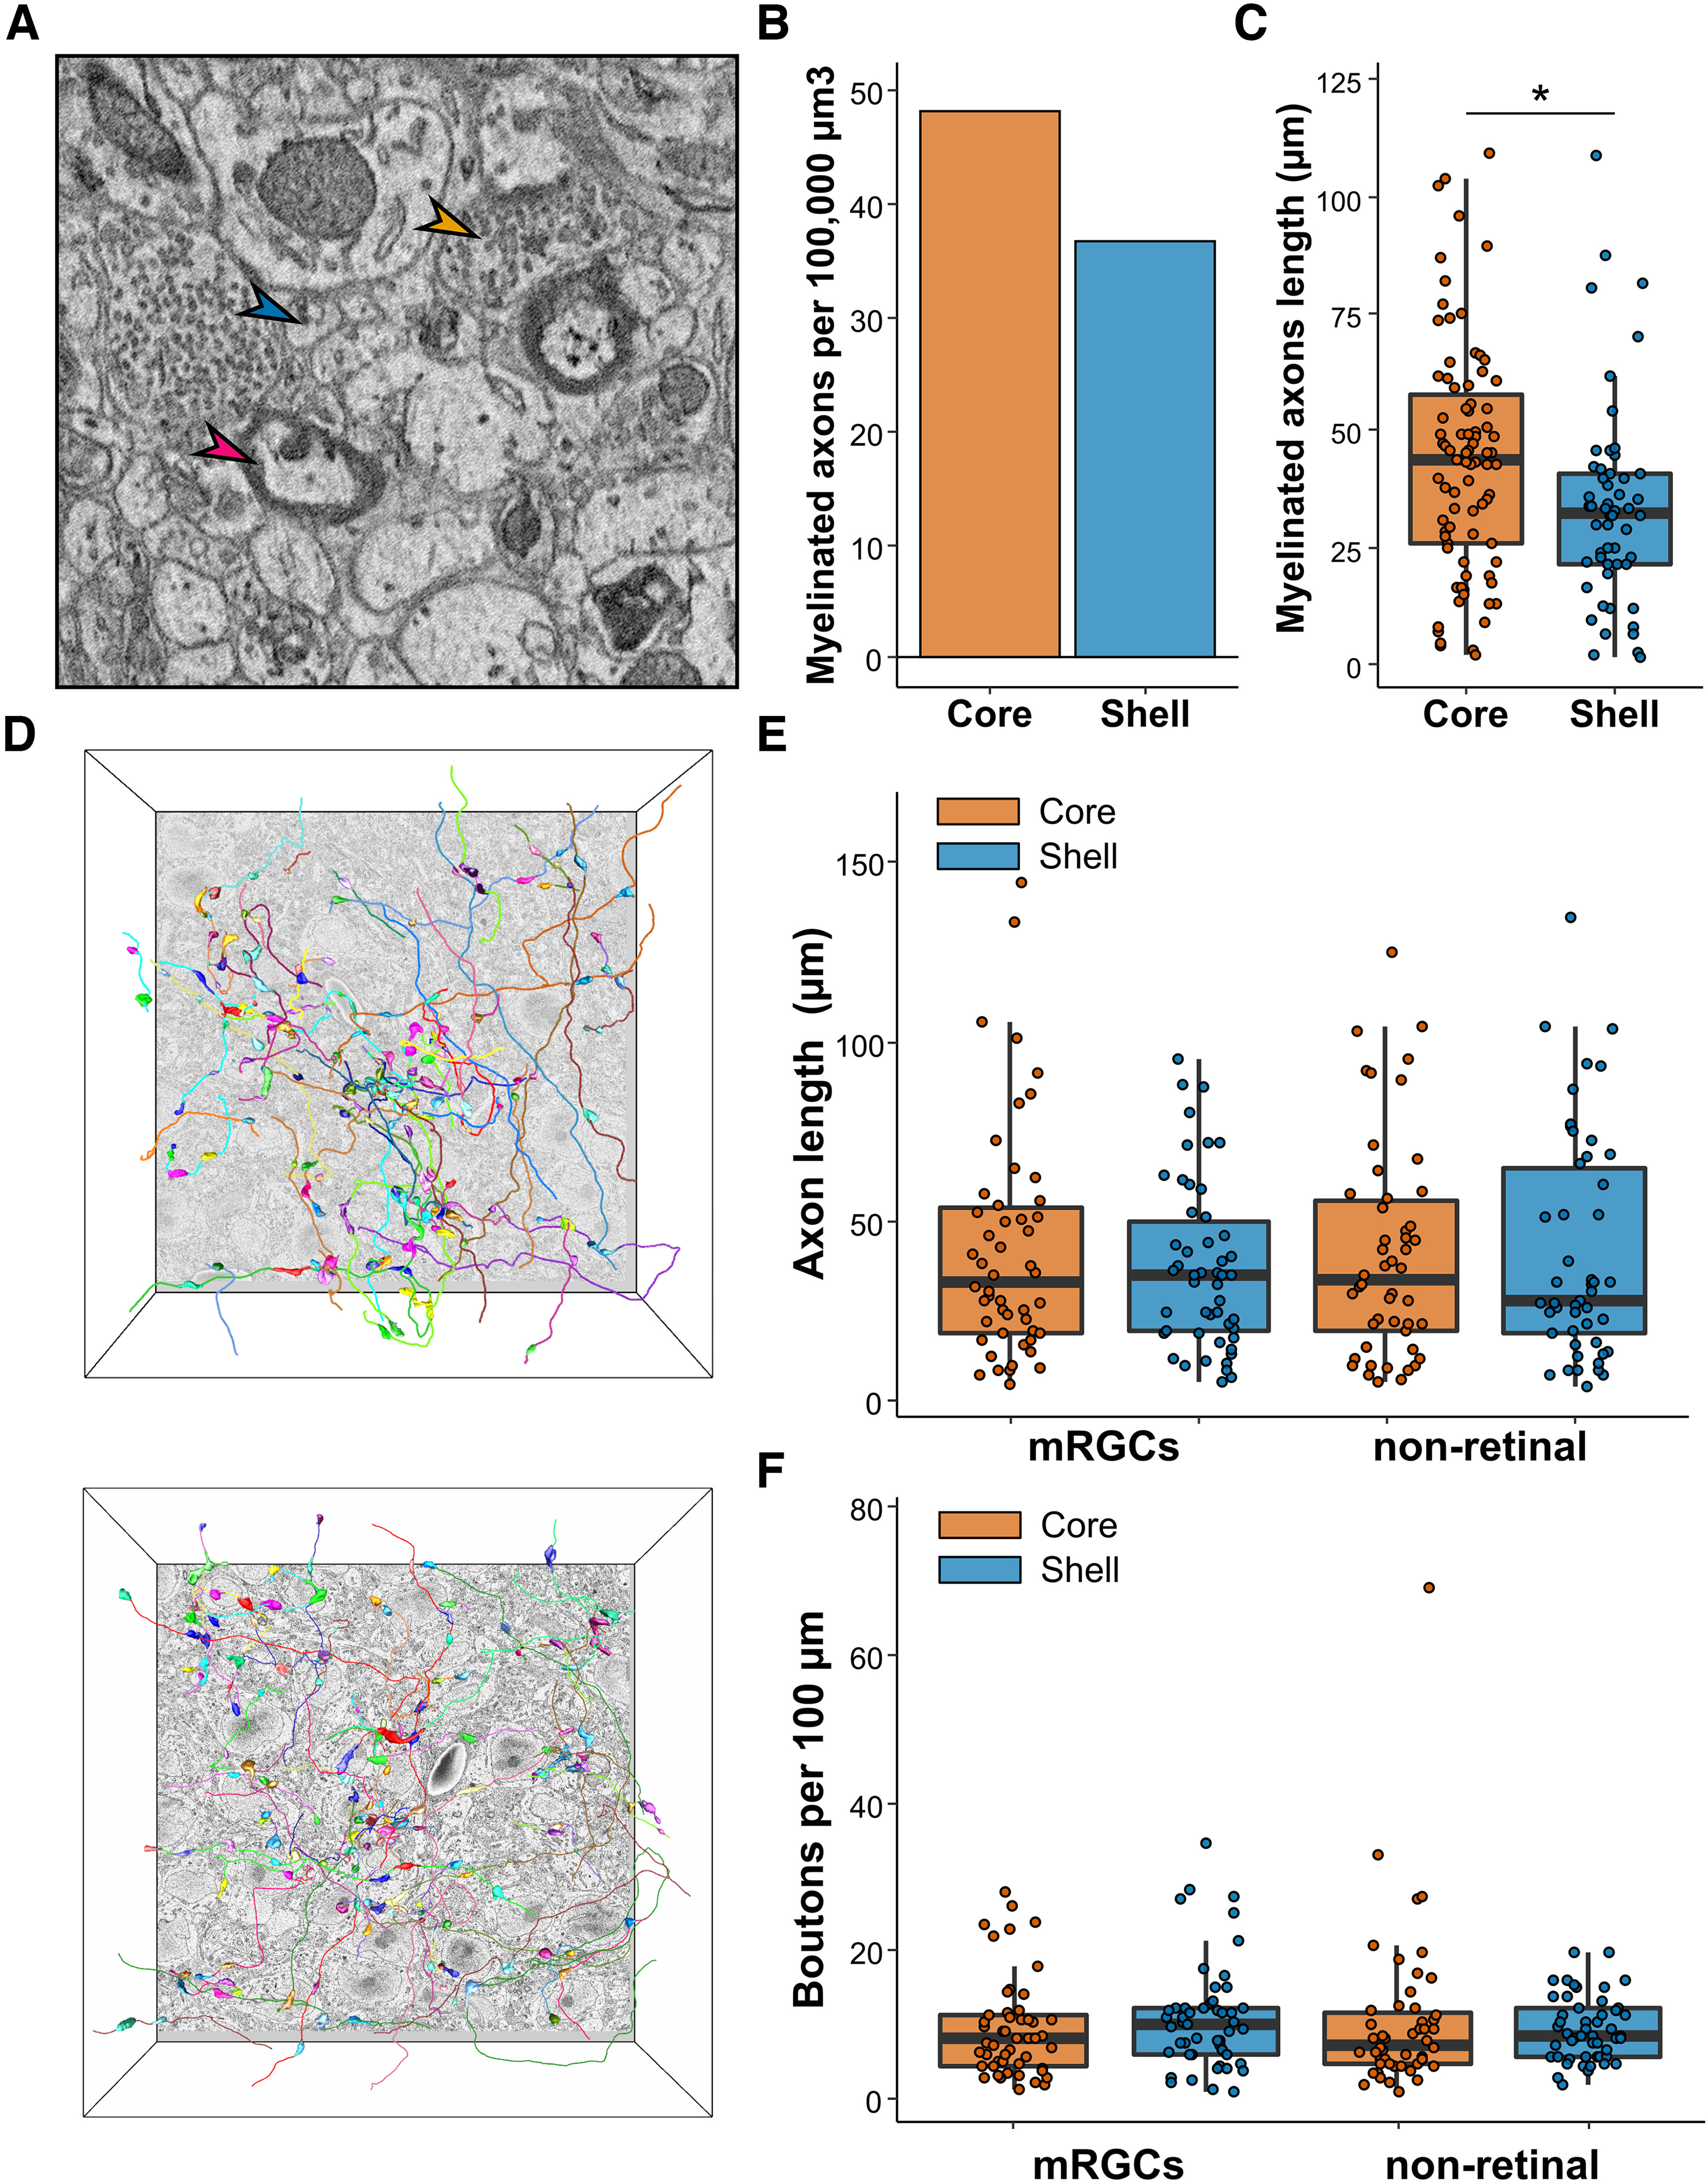
Figure 6.

Myelinated and nonmyelinated axons. A, Representative image of axons found in the SCN. Myelinated axons (red arrow), nonmyelinated axons (blue arrow), and axonic boutons (orange arrow). B, Density of myelinated axons in the SCN volumes. C, Length of myelinated axons in the SCN. N = 83–54. D, Representative image of the fully segmented axons and boutons in the core (upper panel) and the shell (lower panel). N = 50. E, mRGCs and nonretinal axons length. N = 50. F, Boutons linear density along mRGCs and nonretinal axons. N = 50; *p < 0.05.
