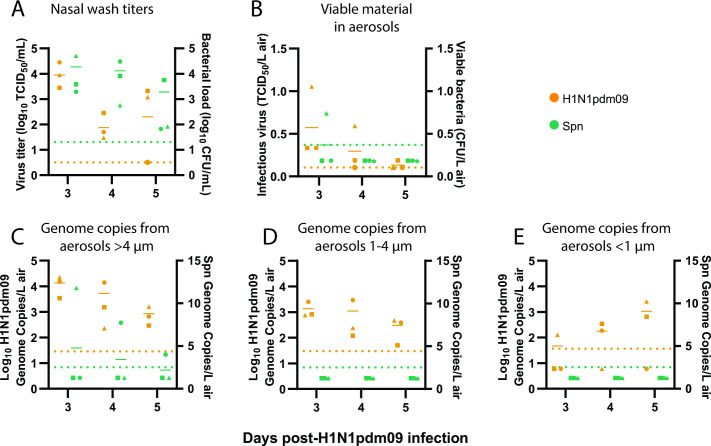
Fig 1.
Co-infected ferrets shed H1N1pdm09 and Spn. Ferrets were infected with 106 TCID50 of H1N1pdm09 and subsequently infected 2 d later with 107 CFU S. pneumoniae D39. (A) Nasal wash loads of H1N1pdm09 and Spn are shown for the days following initial H1N1pdm09 infection. (B) Condensation sampling with a Liquid Spot Sampler was used to collect infectious virus and bacteria shed by co-infected animals. Viral and bacterial loads were measured by TCID50 and CFU assays, respectively. (C–E) Cyclone-based air samplers were used to fractionate and collect microbial genomic material shed from co-infected ferrets in (C) >4 µm droplets, (D) 1-4 µm droplets, and (E) <1 µm droplets. Quantitative PCR was used to measure genome copies for each microbe. For all graphs, orange symbols represent H1N1pdm09 (N = 3) and green symbols represent Spn (N = 3), with each animal indicated by a unique shape and the mean indicated by short, solid lines. Dotted lines denote the limit of detection (LOD) for H1N1pdm09 (orange) and Spn (green). Samples without infectious virus were placed at the LOD, and viable bacteria samples below the LOD were placed at 1/2 LOD. Samples without detectable genome copies were placed at 1/2 LOD (see supplemental materials and methods).

