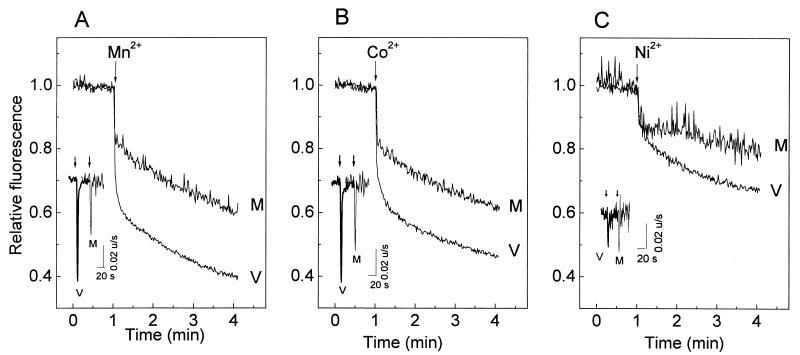
FIG. 7.
Comparison of the permeabilities of the plasma membrane to Mn2+, Ni2+, and Co2+ in rotavirus- and mock-infected MA104 cells. At 7 h postinfection, MA104 cells were trypsinized, loaded with fura-2, washed, and resuspended in medium (1 ml) without added Ca2+. Cations were added to the cuvette at a final concentration of 5 mM (5 μl of a 1 M solution) at the times indicated by the arrows. Mn2+, Ni2+, and Co2+ entry was measured by the quenching of fluorescence with an excitation wavelength of 356 nm, the isoemissive wavelength for Ca2+, and an emission wavelength of 510 nm. The curves represent fluorescence relative to total quenching attained by the addition of digitonin to saturate fura-2 with the indicated quenching cation. The insets show the first derivatives of these traces right after the cation pulse application (arrows). The computer traces for the derivatives have been offset to be able to observe the different curves. The peak value corresponds to the maximal rate of intracellular fluorescence change after cation addition. The experiments shown were performed with the same batch of cells for all ions and for both mock (M)- and virus (V)-infected cells. Results of a representative experiment of a series of four are shown.

