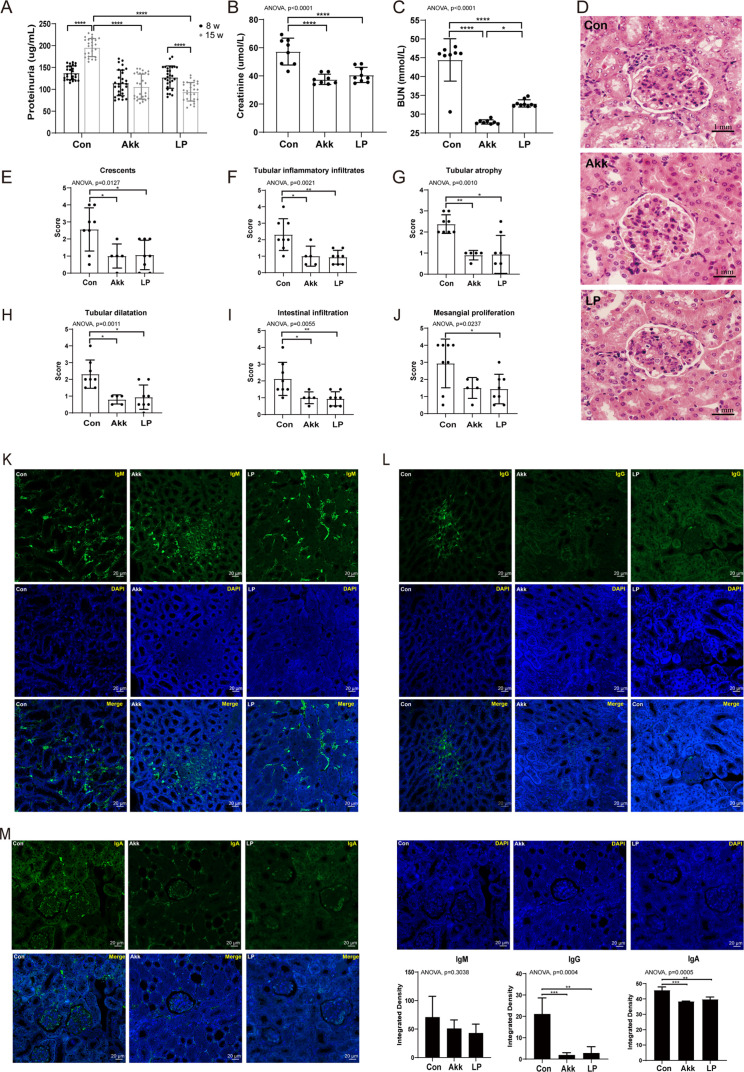
Fig 2.
A. muciniphila and L. plantarum treatment improved renal function. (A–C) Analysis of renal function by measuring proteinuria (A), serum creatinine (B), and blood urea nitrogen (C), n ≥ 13. (D–J) Representative HE-staining images (D) and histological scores (E–J) of the renal tissues at 15-week old, n ≥ 5. (K–M) Immunofluorescent staining of IgM (K), IgG (L), and IgA (M) counterstained with DAPI in the renal tissues, n ≥ 4. The below panel shows the arithmetic mean intensity ratio of probiotic to controls. P values (*P < 0.05, **P < 0.01, ***P < 0.001, and ****P < 0.0001) are shown.

